Visualization of scientific data may be enhanced by applying special techniques in order to convey more extensive information or the same information content in a more striking or memorable manner.
Visualization techniques that can be employed in a relatively simple manner are proposed here. These techniques can be combined to improve the visual impact.
Please contact ACCES should you required any assistance in implementing these techniques, or to suggest alternative visualization techniques that may be of general interest.
1. Stereoscopy
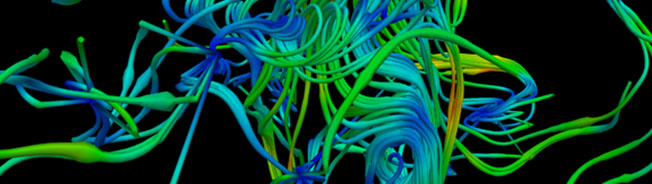
Adding a third dimension to the visual representation of your dataset can be critical in conveying the full complexity of the information content. While the brain can easily infer the depth information from certain 2D representations, in other cases – e.g. a collection of spherical objects as in 3D MD or DEM simulations, or complex streamlines in 3D CFD simulations – the use of stereoscopy can be highly beneficial.
Examples of stereoscopic animations based on anaglyphs are shown on the Scientastic web page.
2. Photorealism
Photorealistic representations of scientific data can not only provide a more striking visual representation, but can in some cases enhance the scientific comprehension of the images. Photorealism is based on including natural lighting effects, such as transparency and shading, into the image rendering. This is generally achieved using ray-tracing or path-tracing techniques.
3. 360o
The ability to interactively adjust the user’s viewpoint in an image (or animation) enables a natural means of exploring the scientific dataset. 360o images are based on an equirectangular projection of a panoramic view, enabling a complete angular representation of the visual data. Such a representation is straightforward to obtain from a 3D numerical simulation dataset since all the required data is available.
