ENAC labs offer semester projects to students of all EPFL sections interested in applying their data skills to ENAC’s datasets and contribute to our mission of guaranteeing a sustainable living environment for humanity.
/!\ Note that these projects may be outdated – check with the labs directly for up-to-date offers.
Last update : 2023.
Index
Machine Learning ( computer vision )
Machine Learning
The energy expenditure of a person is usually connected to their dynamic signs, such as heart rate and respiration rate. In the field of thermal comfort, knowing the person’s energy expenditure can help in evaluating the person’s thermal state. Those signs are traditionally measured with contact sensors, but this may be inconvenient and cause discomfort during continuous monitoring.
There is a demand for non-contact heart rate and respiration rate monitoring systems in different aspects of life and for health in general, either at hospitals, buildings, sports facilities, etc. Camera-based heart rate monitoring technology is one of the more popular research areas. A good example of video base sensing is the Eulerian magnification method [http://people.csail.mit.edu/mrub/vidmag/]. The method amplifies the images frame by frame and shows the human pulse signals.
In this project, a student is expected to work with a set of videos of RGB (Red, Green, Blue) and IR (Infrared) types, and apply the already existing method in the literature in order to extract both the breathing rate and the heart rate of people.
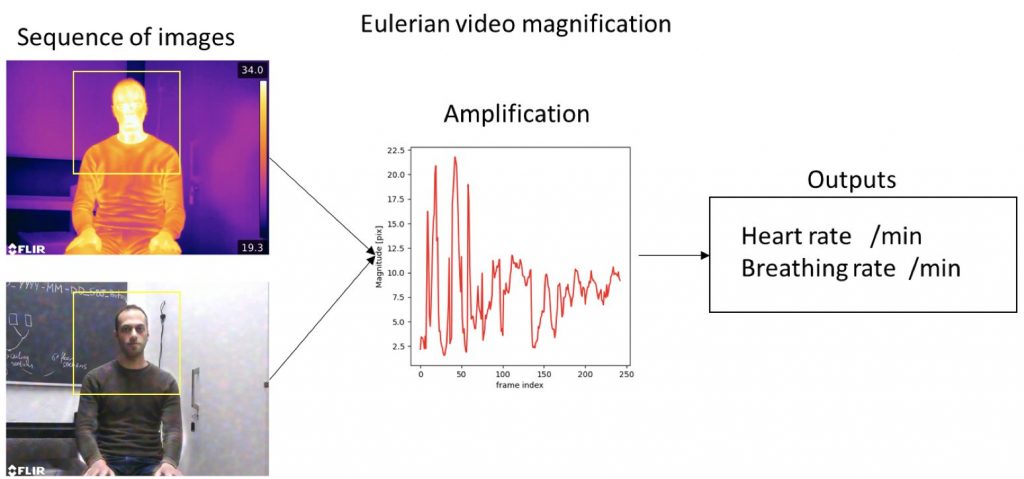
The student is expected to:
- Perform a review on the non-invasive method used for heart rate and breathing rate monitoring.
- Select an appropriate open source algorithm.
- Extract data from the given (IR and RGB) video data set.
- Compare output with the measured heart rate data that corresponds to those videos data set.
At the end of the project, the student will have gain experience in non-invasive sensing methods.
- Learn and develop skills in extracting information from images.
- Expend your knowledge of machine learning and computer vision algorithms.
- Gain experience in non-invasive health-related monitoring methods.
Prerequisites: good knowledge of Python and computer vision.
Contacts: [email protected], [email protected]
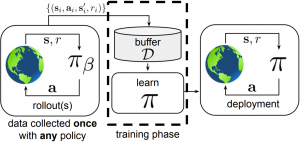
Due to vulnerabilities in GNSS/GPS Systems, on which autonomous systems rely for navigation and control, alternative methods are in demand for absolute large-scale navigation. The low cost, availability of cameras have made them a popular sensor for drones as a way to capture information on the surrounding landscape [1] (depth, semantics, feature and flow tracking).
State-of-the-art (ML) visual re-localisation based methods [2]–[4] show promising performance but typically focus on single-domain training. This poses a serious barrier for the adaptation in real-world scenarios as they require large datasets of high-quality real images within the desired area. Another lacking aspect is the lack of meaningful confidence bounds in the absolute pose estimation. A critical requirement for any downstream navigation filter/scheme.
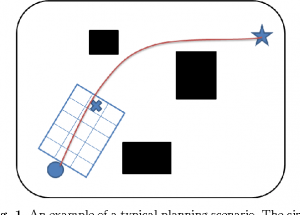
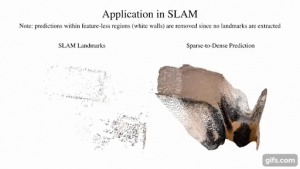
Previous projects at the TOPO lab [5]–[7] aimed at using synthetic data generated with the use of geospatial framework database Cesium [8]. The approach utilized at TOPO can best be summarized in two steps, the first being a coordinate regression by means of a deep neural network followed by the extraction of the pose by a PnP solver (Figure 1).
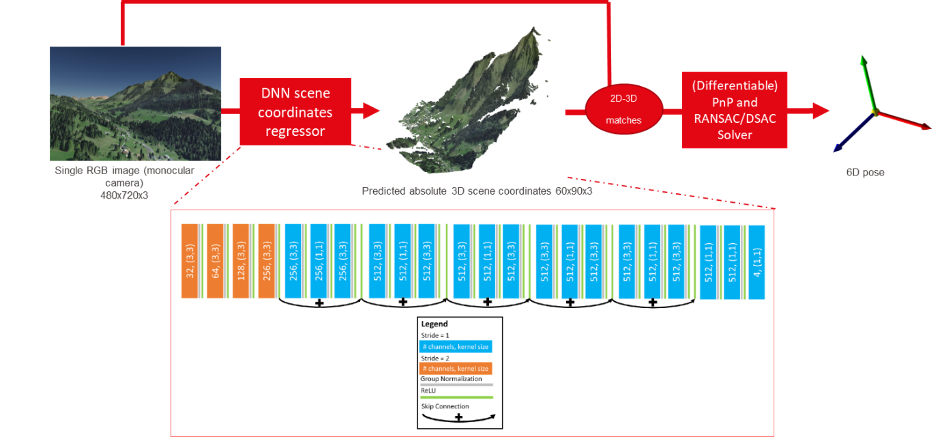
Figure 1: Absolute visual pose re-localisation architecture developed for aerial application by TOPO
The current architecture has shown the median performance of close to 4 m (absolute WSG84 position) and 2.5 deg (orientation) in real images validation datasets and close to 15 m (absolute WSG84 position) in real images validation images datasets. Those results were achieved with synthetic training data and the minimum amount of real data (amount to about 10% of synthetic data) used during the training. This performance is achieved by leveraging several domain adaptation and sim-2-real techniques, including mid-level representation learning and contrastive learning [9]–[12].
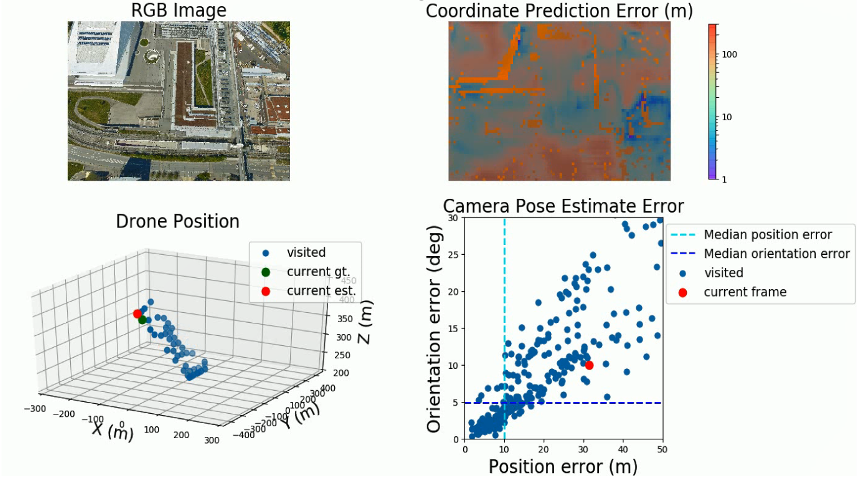
Figure 2: Results statistics example for flight above EPFL
An example of results statistics can be seen in Figure 2. For the RGB input image on display, an error map is shown of the quality of scene coordinates, which propagate to the miss-performing position and orientation estimation.
Those results however promising, are performed on bespoke datasets designed with data from SwissTOPO and bespoke real drone calibration flights done by EPFL students. The current project proposals are looking a step further into validating if this concept can be scaled to a country wide region and thus provide as a viable alternative to GPS/GNSS for Switzerland. Several research questions and thus student project proposals can be defined as continuation/adaptation of this research project into real-life application:
1 – CrossLoc at scale – can we navigate across a whole city or a canton?
When a navigation domain, e.g. a whole city or a canton, is large or ambiguous, a single network does not cover the domain well. Mixture of Experts (MoE) is a popular strategy to divide a problem domain among an ensemble of specialized networks, so called experts, where a gating network decides which expert is responsible for a given input. The challenge here would be to try this technique by generating large synthetic datasets and re-training the existing architecture following the MoE strategy as presented in [2] but focusing only on single (synthetic domain) implementation.
Students tasks:
- Synthetic data generation in a given Swiss region (of student’s choice):
- Data acquisition: Download data from SwissTopo
- Create Tiles (Pre-processing with Cesium 3D)
- Train CrossLoc algorithm for several ‘zones of interest’
- Study the navigation performance as function of the region/training and network sizes following the Mixture of Experts (MoE) concept.
2 – Generalize CrossLoc algorithm to various images quality (from Smapshot images collections)
In this challenge the student should attempt to answer the question if the CrossLoc can be feasibly calibrated to work leveraging on existing crowd sourced visual geo-reference data (https://smapshot.heig-vd.ch/). This is a key challenge to be answered as if possible it will be feasible to calibrate the algorithm with already existing data without relying on additional flights. This work will require a good analysis of the available data https://smapshot.heig-vd.ch/ and the design of pre-processing stage that normalised the different scale and quality images in format (RGB or directly on feature level) which are easy for the CrossLoc network to benefit/calibrate from.
Students tasks:
- Data acquisition from Smapshot’s API
- Images standardization / normalisation with pre-processing with Computer Vision methods
- Train CrossLoc algorithm
- Assess performance of algorithm and the standardisation technique across variable landscapes and real images quality, using SmapShot collections.
3 – Visual GPS Assess CrossLoc’s performance on images of HD 3D model’s synthetic data
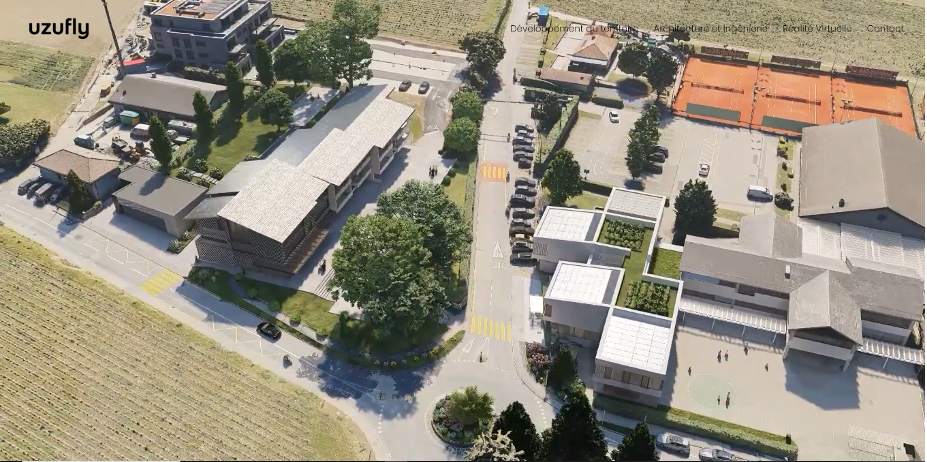
In this challenge the student will take from our partner https://www.uzufly.com/ a HD model of neighbourhood/aerea in Vaud Switserland and attempt to adopt the CrossLoc scheme on this HD data for walking and driving absolute visual navigation.
Students tasks:
- HD dataset generation based on Uzufly provided model
- Capturing a real images (on foot, car and drone) in the location of navigation interest for calibration and test purposes
- Training of the CrossLoc algorithm scheme using the new dataset.
- Evaluation of the dataset and algorithm performance.
Contact: [email protected]
References:
[1] A. Kendall et al., “End-to-End Learning of Geometry and Context for Deep Stereo Regression.”
[2] E. Brachmann and C. Rother, “Expert sample consensus applied to camera re-localization,” in Proceedings of the IEEE International Conference on Computer Vision, 2019, vol. 2019-Octob, pp. 7524–7533, doi: 10.1109/ICCV.2019.00762.
[3] E. Brachmann et al., “DSAC – Differentiable RANSAC for Camera Localization,” in Proceedings of the IEEE Conference on Computer Vision and Pattern Recognition, Jun. 2017, pp. 6684–6692, [Online]. Available: http://openaccess.thecvf.com/content_cvpr_2017/html/Brachmann_DSAC_-_Differentiable_CVPR_2017_paper.html.
[4] E. Brachmann and C. Rother, “Visual Camera Re-Localization from RGB and RGB-D Images Using DSAC,” Feb. 2020, Accessed: Sep. 28, 2020. [Online]. Available: http://arxiv.org/abs/2002.12324.
[5] Q. Yan, “OneShot Camera Pose Estimation for Synthetic RGB Images in Mountainous Terrain Scenes,” EPFL-TOPO, 2020.
[6] Q. Yan, “Visual 6D Pose Estimation with Uncertainty Awareness,” EPFL-TOPO, 2021.
[7] T. Shenker, “NO GPS? NO PROBLEM! TRANSFER LEARNING FOR DNNs USED IN AUTONOMOUS DRONE VISUAL NAVIGATION,” EPFL-TOPO, 2021.
[8] “Cesium – Changing how the world views 3D.” https://cesium.com/ (accessed Sep. 09, 2020).
[9] J. Thoma, D. P. Paudel, and L. V Gool, “Soft Contrastive Learning for Visual Localization,” Adv. Neural Inf. Process. Syst., vol. 33, Nov. 2020, [Online]. Available: https://proceedings.neurips.cc//paper/2020/hash/7f2cba89a7116c7c6b0a769572d5fad9-Abstract.html.
[10] B. Chen et al., “Robust Policies via Mid-Level Visual Representations: An Experimental Study in Manipulation and Navigation,” arXiv, Nov. 2020, Accessed: Mar. 09, 2021. [Online]. Available: http://arxiv.org/abs/2011.06698.
[11] A. Sax et al., “Learning to Navigate Using Mid-Level Visual Priors,” Accessed: Aug. 16, 2021. [Online]. Available: http://perceptual.actor.
[12] J. Hoffman et al., “CyCADA: Cycle-Consistent Adversarial Domain Adaptation,” 2018.
Context
All the excess heat produced by the body needs to dissipate to the surrounding environment to keep the body in thermal neutrality and prevent the core body temperature from increasing. The process of body temperature regulation requires the body to balance between the internal heat generated due to the human metabolism and the heat losses from the human body due to evaporation, radiation, convection, and conduction with the environment since fundamental laws of thermodynamics apply to the human body.
In this project, the goal is to train a human thermos-physiology model (HTPM) based on a given data set. The model should be able to take multiple inputs and provide multiple outputs. To this aim, a supervised machine learning algorithm needs to be used. Different algorithm approaches should be tested and the most appropriate ones selected to solve the problem.
The data set will involve the following environmental variables at the human body level: air temperature, mean radiant temperature, relative humidity, air speed. Personalized data such as age, gender, BMI, clothing type, and insulation will also need to be considered, in addition to the skin temperature at local body parts, core temperature, heat losses from each body part, skin blood flow, shivering, and sweating. For training the model, 5 personal parameters and limited local skin temperatures should be used.
In this project, the goal is to apply some of the newly developed machine learning approaches by using ensemble learning algorithms such as the XGBoost, which handle a large data set to train a human thermal physiology model.
Prerequisite: background in Machine Learning, especially supervised learning.
Contact:
Context
Energy expenditure in human body which includes resting energy expenditure, represents the energy needed to support minimal daily functions, accounting for two-thirds of total daily energy expenditure, and physical activity. Normally in a laboratory environment the energy expenditure of the human body is accurately measured with direct and indirect calorimetry. However, such techniques are intrusive and very difficult to use it for measurements in a real-life office setting. Recently, in the area of computer science, a behavior recognition technology has been developed that utilize visual images captured by a camera (e.g., Kinect camera) to extracts an actual behavioral information. These data are frequently integrated with many computational processes, especially for a computer game, virtual reality, and motion detection. Therefore, this project exploits the currently developed computational sensing technology, e.g., Kinect sensor, to collect and process a building user’s behavioral information in order to develop an accurate energy expenditure prediction model as a function of users’ graphical data-driven principle. Considering the technical compatibility with the Kinect camera, this project would focus on development of Deep Learning algorithm for the effective energy expenditure prediction.
Data description :
The visual data would consist of sequence of 3d scans involving human subjects taken with Kinect camera during different office activities. Along with it, the energy expenditure of the human body would be recorded using specific physiological measurements (heart rate, accelerometry, etc.). Collected data would be used to train the deep learning algorithm that would predict the energy expenditure of the body based on the 3d scanned images collected by Kinect.
Project objectives :
The goal of the project is to develop a deep learning-based algorithm that can predict the instantaneous energy expenditure of the human body from the visual data collected with Kinect camera.
Pre-requisite:
Basic knowledge of Python and machine learning.
Contact:
Context
Energy expenditure in human body which includes resting energy expenditure, represents the energy needed to support minimal daily functions, accounting for two-thirds of total daily energy expenditure, and physical activity. Normally in a laboratory environment the energy expenditure of the human body is accurately measured with an indirect calorimeter. However, this instrument is very bulky and it is very difficult to use it for measurements in a real-life office setting. Thus, it becomes increasingly important to develop a model for the prediction of energy expenditure from combination of other more easily measurable physical and environmental parameters such as heart rate, muscular electrical activity, skin temperature, core body temperature, skin conductance, air temperature and relative humidity. With the advent of machine learning and particularly supervised learning, this above task becomes less challenging to execute. Supervised learning is the machine learning task of learning a function that maps an input(s) to an output based on example input-output pairs.[1] It infers a function from labeled training data consisting of a set of training examples.[2] In supervised learning, each example is a pair consisting of an input object (typically a vector) and a desired output value (also called the supervisory signal). A supervised learning algorithm analyzes the training data and produces an inferred function, which can be used for mapping new examples. In our case supervised learning can be used to map the energy expenditure data from above mentioned easily recordable parameters.
Data description :
For setting up the predictive model several exploratory experiments have been conducted in the past. In these experiments multiple physiological parameters were recorded as a function of the variation in the indoor temperature and activities. These measured parameters are heart rate, energy expenditure, activity, skin conductance, skin temperature, core body temperature, air temperature and relative humidity. The initial step would be data cleaning in order to transform the raw data in machine readable format. Prior to framing the algorithms, data visualization can help to derive important insights on the general trends of the data. The data would be divided into two parts, training set and test set. The different supervised learning algorithms would be trained on the training dataset and the performance of the models would be assessed on the test dataset.
Project objectives :
The goal of the project is to develop a few different supervised learning-based models that accurately predicts the energy expenditure in the human body. The different algorithms that would be used (but are not limited to) polynomial regression, support vector regression (SVR), decision tree regression and random forest regression.
Pre-requisite:
Basic knowledge of Python and machine learning.
Contact:
Context
About 40% of our society’s energy demands stem from buildings since 90% of the time people spend indoors nowadays. Thus, indoor environmental quality (IEQ) parameters, including thermal comfort, are important to be accounted for in new and existing buildings to assure the well-being of the occupants. And for that purpose, the building controls play a very important role. An efficient controller can not only ensure a high indoor environment quality but also minimize the energy consumption of the building. In recent times reinforcement learning has emerged as an exciting prospect in the design of intelligent controllers. Reinforcement learning (RL) is an area of machine learning concerned with how software agents ought to take actions in an environment in order to maximize the notion of cumulative reward. It differs from supervised learning in not needing labelled input/output pairs be presented, and in not needing sub-optimal actions to be explicitly corrected. Instead, the focus is on finding a balance between exploration (of uncharted territory) and exploitation (of current knowledge). This concept can be applied to the calculation of the optimal setpoints in the office buildings which can potentially improve the indoor environment quality and maximize energy savings.
Data description :
For setting up the Deep Reinforcement Learning (DRL) problem formulation several exploratory experiments have been conducted in the past. In these experiments multiple physiological parameters were recorded as a function of the variation in the indoor temperature and activities. These measured parameters are heart rate, energy expenditure, activity, skin conductance, skin temperature and core temperature of the human body. This data would be used in the defining the states, actions and rewards for the reinforcement learning framework.
Project objectives :
The goal of the project is to develop few different reinforcements learning based controllers such as q-learning, deep q-learning and deep deterministic policy gradient (DDPG).
Pre-requisite:
Basic knowledge of Python and machine learning.
Contact:
Summary
The prediction of long-term wind speed is essential for the development of wind energy. Meteorological reanalysis datasets provide with estimates of the main atmospheric and climate variables. They are the result of the assimilation of a combination of data sources including measurement, observation and simulation data to describe weather occurrences in the closest way to reality. Reanalysis are only available for historical time periods and usually up to present. While wind speed data from reanalysis sources are widely used in wind resource assessment, they do not inform on the future state of the local climate. Climate models are the main source of knowledge on the future state of climate variables, including wind speed. Yet their uncertainty and low spatial resolution render their use difficult for wind assessment. The purpose of this project is to use machine learning methods to generate wind speed data projections based on historical data from reanalysis datasets and provide with higher resolution data than the current climate models in India.
Context
Since the world is moving towards green energy, wind energy will play a vital role in the future energy system. Long-term wind speed forecasting is critical for energy development and management, and wind farm optimal design. The historical trends and future projections of the wind resource provide a scientific basis for long-term planning. Currently many wind speed prediction methods exist and include physical methods, statistical methods, and artificial intelligence methods. Neural network forecasting methods are widely used in various areas including sustainable urban development and financial forecasting. Recently, there has been growing interest in the possibility of using neural networks for both weather and climate forecasting. The possibility to further explore neural networks application to improve long-term wind speed prediction in regions threatened by climate change could offer further incentive for wind energy developers. Such predictions would offer an alternative to current regional climate models that can be used as a baseline for the comparison.
Data description
The data available for this project are the following:
- Climate variables from ERA5 which is the most recent reanalysis dataset produced by the European Centre for Medium-Range Weather Forecasts (ECMWF; http://www.ecmwf.int/en/forecasts/datasets/reanalysis-datasets/era5). ERA5 provides with a global coverable on a 30 km grid, and hourly estimate of a large number of climate variables. The ERA5 includes wind speed measurements at 10 m and 100 m height from 1979 to present, along with other variables made available for this project.
- Wind speed projections from Regional Climate Models in the regions: 10 m wind speed at 25 km for wind speed at 10 m with time resolution of 3h (also daily, and monthly).
Project objectives
The purpose of the study is to use the ERA5 of the last 40 years (1979-2019) for long-term forecasts of wind speed at 10 m height in India.
Contact: [email protected]
Summary
Composite materials in engineering structures face different loading conditions during operation. It is well documented that a major percentage of structural failures happen due to fatigue or fatigue-related phenomena. Most of them are unexpected failures due to defects on the microscale that cannot be identified and do not present any indication, such as a measurable property reduction prior to failure. Modeling of the fatigue/fracture behavior of composite materials is very challenging and has attracted the interest of the scientific and the engineering communities for several reasons. Machine leering techniques can help the development of modeling tools.
Context
Everything that is loaded, even if the loads are low, has a finite life. Fatigue theory is basically empirical/phenomenological; the process of the initiation of microcracks that finally will form macroscopic cracks in the material is not taken into account specifically in the relevant equations. The fatigue properties should therefore be analyzed statistically due to the large variations exhibited during testing. Numerous experimental programs have been conducted over recent decades for the characterization of the fatigue behavior of several structural materials of that particular time. As technology developed and new test frames and measuring devices were invented, it became far easier to conduct complex fatigue experiments and measure the properties and characteristics of materials, of structural components, even of full-scale structures. As a result, almost all failure modes were identified and many theoretical models have been established for modeling and eventually predicting the fatigue life of several different material systems. Significant support has been provided by the new monitoring and damage identification techniques, such as the Digital Image Correlation (DIC) and x-ray tomography. Nevertheless, fatigue theories, even today, are basically empirical. Fatigue model equations dealing with damage and remaining life are, literally, “fitted” to existing experimental data from material/component testing in order to calibrate their parameters and produce reliable simulation of the exhibited behavior and/or prediction of the fatigue life under different loading conditions or material configurations.
Project objectives
This project aims to develop and implement machine learning tools for the simulation of the quasi-static and fatigue/fracture performance and damage development of composite materials and structures.
Data description
The training data consists of derived data from experiments under different loading conditions including fatigue loading at different R-ratios, and different fracture modes. Load/displacement/lifetime data are available for different material systems and joints, as well as a great number of DIC and thermal camera photos collected during the experiments. Previous work shown that this is feasible for fatigue life modeling, see e.g., [1-3], although such methods have not be applied for modeling fracture mechanics data, neither of for the interpretation of DIC and thermal camera photos.
Contacts : [email protected], [email protected]
References
- P. Vassilopoulos, R. Bedi, “Adaptive Neuro-Fuzzy Inference System in modelling fatigue life of multidirectional composite laminates”, Comput Mater Sci, 2008;43(4):1086-1093
- P. Vassilopoulos, E. F. Georgopoulos, T. Keller, “Comparison of genetic programming with conventional methods for fatigue life modelling of FRP composite materials”, Int J Fatigue, 2008;30(9):1634-1645
- A. P. Vassilopoulos, E. F. Georgopoulos, V. Dionyssopoulos, “Artificial neural networks in spectrum fatigue life prediction of composite materials”, Int J Fatigue, 2007;29(1):20-29 (In the TOP25 Hottest Article list of Int J Fatigue for the period Oct-Dec 2006)
Recent success stories of playing atari games or Alpha Go have shown that it is possible to rethink traditional Operational Research (OR) problems with Deep Reinforcement Learning (RL) techniques. The goal of this project is to revisit popular OR problems with Deep RL and compare them.
Contact: [email protected]
Signal re-construction and even super-resolution can be advantageous in many applications. In this use-case, the goal of the project is to inspire onseleves of recent advances in Image enhancing and apply it to a different type of data: Audio. Mainly, Generative Adversarial Models (GAN) and associated new methods are investigated.
Keywords: GAN, Audio, Signal Enhancing, Embedding, Super-Resolution, Fourier Transforms, Mel Spectrogram, Convolutional Neural Networks
Contact: [email protected]
On one hand, Discrete Choice Models have emerged as a convenient and powerful theoretical framework for analyzing individual travel behavior, yet often lack predictive power. On the other hand, Neural Networks have shown stunning predictability performance, yet with poor interpretability. In the project, the student will connect both worlds and study how to get the extract the best of each, aiming for explainable A.I.
Applications to modeling human behavior: Transport Mode Choice, Intention Prediction, Trajectory Forecasting, … .
Reference papers:
- Sifringer, Brian, Virginie Lurkin, and Alexandre Alahi. “Enhancing discrete choice models with representation learning.” Transportation Research Part B: Methodological 140 (2020): 236-261.
Keywords: Discrete Choice Models, Statistical Models, Neural Networks, Representation Learning, Novel Architectures, Interpretability
Contact: [email protected]
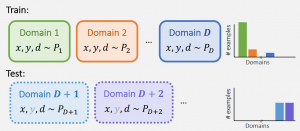
Recent advances in machine learning have brought tremendous successes in the i.i.d setting, where test samples come from the same distribution as the training data. However, to deploy the learned models to safety-critical systems like self-driving vehicles, we also need them to function robustly in the real-world under a wide variety of conditions, some of which may be underrepresented by, or even absent from, the collected training data. When this discrepancy occurs, conventional learning techniques often fail drastically [1]. In this project, we aim to address this fundamental challenge from the self-supervision perspective [2]. In particular, we will explore methods that can incorporate prior knowledge to reliably adapt models at test time.
Reference: [1] Wilds: A Benchmark of in-the-Wild Distribution Shift, 2020 [2] Social NCE, 2020
Prerequisite: fluent in Pytorch / Tensorflow, passionate about research / open problems, familiar with ML fundamentals
Contact: [email protected]
Flow cytometry (FC) is a common high-throughput laboratory technique to detect and measure optical properties of cells. In FC, suspended cells are hydrodynamically focused and then pass a laser beam. Typically, individual cells pass the laser beam at a high rate (thousands of cells per second) and multiple optical properties, such a fluorescence and scatter are simultaneously measured. In the SBER lab, we use FC to count bacterial cells in environmental samples. Currently, we are working on samples from glacier-fed streams all around the world. These samples typically contain only relatively few bacterial cells and at the same time show high background noise in FC. This background is typically caused by mineral particles of similar size to bacterial cells.
The aim of this semester project would be to establish a machine learning routine which makes use of the multi-parameter nature of the FC dataset to differentiate between bacterial cells and background noise. The idea is to identify samples in which background noise and cell signal are distinct and to learn from these samples the optical signatures of bacterial cells. Then, the algorithm should apply these criteria to samples in which cell signal and noise overlap.
Contacts: [email protected]
Description :
The control of energy flows in building sectors is one of the most important factors to reach sustainable development strategies for reducing greenhouse gas emissions by 2050. The model-based and data-driven approaches are two methods to determine the dynamic profile of the energy flow in building envelopes. The accuracy of the physical models and correlations employed in the former approach highly affect the performance and reliability of the solution. On the other hand, the data-driven modeling approach tries to learn the system characteristics from the data measured and requires high computational costs throughout the learning process.
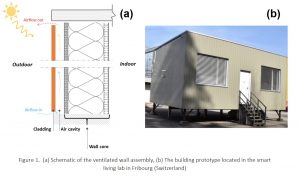
The wall structures incorporating air-spaces behind traditional claddings can potentially reduce energy use by buildings and boost the thermal efficiency of dwellings. The airflow in the cavity behind the cladding depends on the indoor and outdoor conditions, as well as, the thermo-physical properties of the entire wall assembly. The airflow in the cavity can remove the accumulated heat behind the external cladding; moreover, the heat flux entering/leaving the indoor space could be affected by variation of the airflow in the air-space. Therefore, accurate and reliable models are required to predict the airflow rate in the ventilated air-spaces, and investigate the impact of the thermo-hydrodynamic behavior of the airflow passing through the air gap on the heat flows to the building.
To model the system, two approaches could be employed; either the classical physics-based modeling or the innovative data-driven modeling. The physical model for the former approach is already developed in MATLAB using a 2-D finite difference method at ICE, and the results are validated against the extensive data measured in a building prototype located in the Smart Living Lab in Fribourg.
This project aims to employ the data-driven modeling approach to predict the airflow rate in the naturally ventilated air-space behind the external cladding of the same building prototype. The input data required for data-driven approach are available from the detailed experimental measurements. The data listed below are being continuously collected in CSV format at 1-minute intervals starting from March 2021 (except for a few weeks in which the data logging stopped due to the technical issues):
- Weather data (i.e., outdoor temperature, wind speed, wind direction, solar radiation)
- Temperatures at various locations distributed on each surface of the wall structure (i.e., cladding, insulation, the interior surface adjacent to the indoor space)
- Indoor air temperature
- Airflow temperature at various locations distributed inside the air gap
- Airspeed in the middle of the air gap
- Heat flow passing through the interior surface
The ultimate objective of the project is to compare the results of the two approaches and outline the advantages and limitations of the data-driven modeling method employed for analyzing the thermal performance of the ventilated building element.
Planning :
1. Perform a comprehensive literature review on various data-driven methods used for the prediction of airflow in the ventilated air-spaces behind external claddings (if any)
2. Recommend the best suitable data-driven scheme to model the system by taking into account the dynamic variation of the indoor and outdoor conditions
3. Develop the data-driven model to predict the airflow rate in the air-space applying the input data measured in the test building
4. Compare the results of the data-driven approach with the model-based approach and with the measurements
5. Outline the advantages and limitations of each approach for modeling the system
6. Provide a control strategy for an adaptable fan-assisted system that could intelligently apply the airflow in the cavity to simultaneously yield the lowest heat loss from the building envelope and the highest heat recovery potential from the air-space
Necessary tools: MATLAB, Python
Domaine(s) d’activité: Architecture, Structures, Thermique Physique
Enseignant Principal I (valide le projet) : Dolaana Khovalyg
Enseignant Principal II : Mohammad Rahiminejad
Contacts: [email protected], [email protected]
Machine learning (Computer vision)
Context
Office employees are exposed to a variety of environmental and contextual stimuli that influence their comfort and behavior in the built environment. Despite the advancements in the understanding of separate fields of comfort (thermal, olfactory, visual, and acoustic), the combined effect of Indoor Environmental Quality (IEQ) factors on user perception and behaviour in real buildings merits further explorations. Determining how indoor environmental conditions influence occupants’ perception of comfort and consequently their desire to change their conditions through interactions with the building envelope might be even more challenging in open space offices, since the same space might be occupied by a large variety of humans with different individual preferences over the indoor environment and needs for having an acceptable and productive work environment. Further, current comfort standards or models may not always meet actual user preferences, and comfort/preference votes of occupants should be carefully and jointly evaluated with environmental measurements in the space to gain deeper insights into the discrepancies of comfort perceptions among individuals and between individuals and standardized comfort parameters.
Data description
The dataset includes environmental measurements in a Swiss open space office and subjective responses from the building occupants. In particular, the multi-domain data collection strategy included the monitoring of four environmental dimensions: thermal, olfactory, visual, and acoustic. The objective data collection was performed simultaneously with point-in-time surveys of occupants’ perceptions of comfort/preference votes and motivations behind their actions, as well as long-term surveys on (i) employees’ background information (e.g., personal characteristics, work routines, etc.) and (ii) employee’s personal perception that might be sensitive to seasonal variations (e.g., personal comfort preferences, perceptions, satisfactions, preferred adaptive opportunities etc.).
The data size collected with the environmental sensors (quantitative data) is approximately 20.000 datapoints (2 weeks of measurements in 1-minute timesteps*5 monitoring campaigns across different seasons).
The data size of point-in-time survey answers (qualitative data) is approximately 500 datapoints (100 datapoints*5 campaigns across different seasons).
Project objective
The objective of this project is to find correlations between the quantitative (physical measurements of the environment) and qualitative (subjective feedback from the employees concerning their environmental comfort) data. Environmental data and subjective feedback from the occupants should for instance be evaluated jointly to gain insights into the relationship between comfort/preference votes over the indoor environment and actual environmental conditions in the space at the time of the response, also in relation to actions performed by the occupants. The data can further be analyzed according to different seasons/buildings and the respondent’s location in the space (e.g., close to window vs central vs corridor).
Semester student project
Pre-requisite: solid statistics background
Contacts: [email protected], [email protected]
Context
The human interaction with the building is a key cause of uncertainty when predicting energy consumption of buildings with energy simulation tools. Building occupants affect building energy use directly and indirectly by interacting with building energy systems, for example, by adjusting thermostats, switching lights on/off, using electrical devices and opening/closing windows.
To reduce current inconsistencies in building energy simulation, several probabilistic and data-driven modelling approaches have been developed, and integrated into advanced simulation programs to account for uncertainties related to human factors when predicting building energy consumption. These approaches include models for occupancy patterns, occupants’ activities, adjustment of thermostat settings, or usage of plug-in appliances, and sometimes also aim to anticipate the operation of windows and lighting controls or the regulation of window blinds/shades as functions of various environmental (e.g. indoor/outdoor temperature) and contextual drivers (e.g. time of the day). Current predictive methods for data-driven modelling of occupant behaviour in the built environment include for instance:
- Logistic regressions (examples)
- Markov chain models (examples)
- Bayesian networks (examples)
- Machine learning methods (examples)
Data description
The data collection involved a wide range of environmental variables in a Swiss open space office, including the 4 Indoor Environmental Quality categories (thermal, IAQ, visual, and acoustics), tracked behavioural data (e.g. window and window blinds control actions) and occupants’ subjective feedback (personal characteristics, comfort perception and self-reported motivations behind interactions with windows and window blinds) collected through point-in-time and long-term surveys.
The data size collected with the environmental sensors is approximately 20.000 datapoints (2 weeks of measurements in 1-minute timesteps*5 monitoring campaigns) across different seasons. It is a rather unbalanced dataset due to “rare-event” target variables (e.g. window opening).
Project objective
The main objective of the project is to explore different predictive modelling strategies that best capture occupants’ control action (over windows and blinds) using quantitative measurements as explanatory variables. The aim is to highlight key influencing factors behind actions based on the collected quantitative data and verify if the findings match with self-reported motivations by the occupants, also in relation to their perception of environmental comfort.
Semester student project
Pre-requisite: statistics background, data analysis and modeling experience
Contacts: [email protected], [email protected]
Context
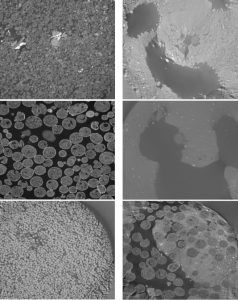
Tree responses to drought remain the largest uncertainties for climate change predictions. The root system is a key organ for tree survival during drought by foraging for scarce water resources, but it is heavily underrepresented in climate change research. Expanding our understanding of root dynamics during drought has therefore become an important research frontier in recent years. Due to the hidden nature of roots, their structure and function have usually been determined with destructive sampling methods, but with modern micro-CT scanning we can create in-situ 3D images of tree roots without creating any disturbance in the soil.
Retrieving 3D images of root systems from soil scans is, however, not trivial. With preliminary tests, we have been evaluating the challenges of retrieving the root system from scans of tree seedlings growing in different substrates. While certain substrates can be easily be distinguished from the roots, and therefore existing segmentation methods can be used, more complex substrates, such as natural soils have not yet been successfully processed. The main challenge of identifying the 3D root structure is to distinguish the soil from the roots in an efficient automated way in a large number of micro-CT images.
Data description :
The original CT-scans can be reconstructed along the Z-axis (horizontal slides), which results in greyscale TIFF images with a resolution of approximately 1’700 x 1’600 pixels and a size of 5.6–8.5 MB per image, depending on the content of the image. Approximately 1’500 images are created for each scan, resulting in 8.7–13.3 GB of data per scan. 6 scans of roots in different soil types were taken, thus in total about 60 GB of data is available. The 6 scans can be used to split the dataset and test generalizability of the model.
Project objectives :
The aim of this project is to automate the pipeline to segment the roots in all the six soil substrates. The first step would be to set up the labelling pipeline, and label more training data, together with PERL scientists. Currently, about a hundred of images from the clay ball
substrate have been labelled by hand, and the same number of images will need to be labelled for each of the other five substrates. The second and main step of this project is to build an image segmentation model to identify the roots in the images. The student could build on models pretrained on comparable images, and/or explore new algorithms that will be trained with the labelled images. One of the big challenges will be generalizability of the segmentation algorithms across the different substrates. The models will be evaluated on both precision and recall. An optional last step would be to construct a post-processing pipeline to validate findings across images of the same root at different depths. The final chosen model should be deployed to be easily re-used by the community, and this would be a valuable contribution to the field.
Contact:
Dr. Christoph Bachofen, PERL: [email protected]
Prof. Charlotte Grossiord, PERL: [email protected]
Charlotte Weil, ENAC-IT: [email protected]
Context
Computer vision is the field of computer science that focuses on replicating parts of the complexity of the human vision system and enabling computers to identify and process objects in images and videos in the same way that humans do. Until recently, computer vision only worked in limited capacity. Thanks to advances in artificial intelligence and innovations in deep learning and neural networks, the field has been able to take great leaps in recent years and has been able to surpass humans in some tasks related to detecting and labeling objects. In the past we have run multiple experiments that involved the use of FLIR infrared camera to capture infrared sequences (sequence of images) of human subjects. Now the objective is to take the person’s silhouette in the form of infrared images or sequences and determine the variation of the temperature over time at a particular point or over a certain area
Data description :
The raw data consists of sequence of infrared images involving human subjects taken with high-resolution FLIR infrared camera. The images can be processed manually but it would be a highly time-consuming procedure and given the advancement in the field of deep learning and neural network, it is a task can be more efficiently handled by computer vision.
Project objectives :
The goal of the project is to develop deep learning-based algorithm that can detect the changes in the temperature at a point or over a certain area from infrared images and sequences.
Pre-requisite:
Basic knowledge of Python and machine learning.
Contact: [email protected], [email protected]
Summary
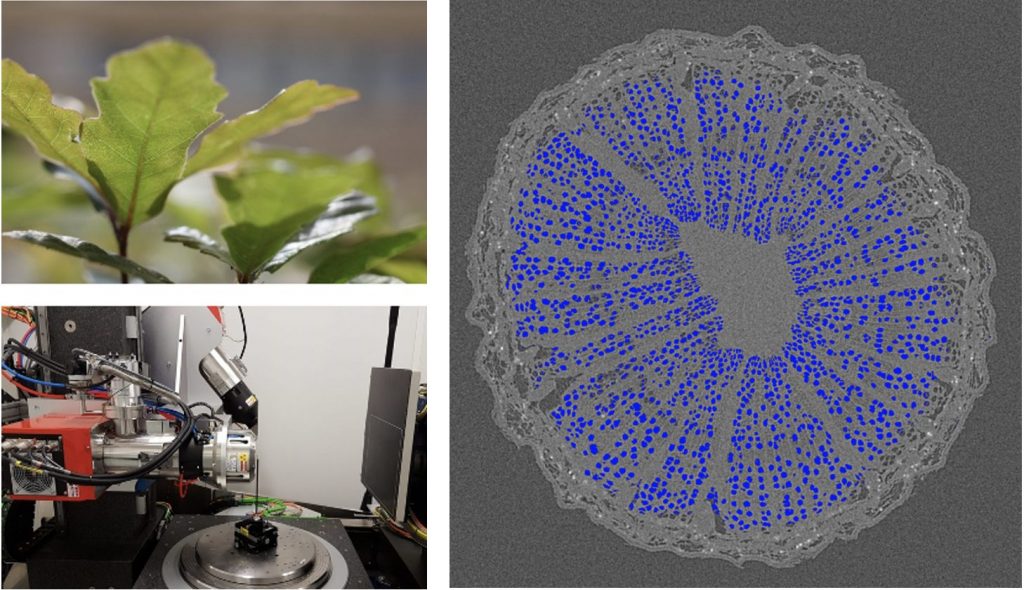
Water transport in plants is crucial to their productivity and survival; better understanding water’s internal dynamics in plants and trees provides insights in their reaction to climate changes. X-ray micro-tomography images allow to view water bubbles in plant compartments, in order to quantify water transport. An automated pipeline to segment the water bubbles from these images would greatly speed the workflow: This projects aims to develop and implement an image segmentation algorithm to delineate the water bubbles in the tree trunks images obtained from X-ray micro-tomography.
The training data consists of hundreds of labeled images, each containing up to hundreds of water bubbles. A preliminary project already set up a pre-processing pipeline, cropping images to the same resolution, as well as optional data augmentation. A simple implantation of UNet on Pytorch has also already been tested, and provides a baseline. The aim of this project is to build on this pipeline, tune this model or explore other image segmentation algorithms and compare performance. The models will be evaluated on both precision and recall. The final model should be deployed to be easily re-used by the community.
Contact: [email protected], [email protected]
For the Xplore Mars Rover, the rover has to move in an unknown environment. Because the sensors we use cant yield a complete elevation map of this environment, many parts of this maps are yet to be discovered, which becomes a immense challenge for the path planner.
In this project you will optimize our current path planner to take into consideration such unknown areas in the map.
Note : You should not assume that the coordinates of the target positions are known ( AR-tag in the competition ). This is the interesting part of the project and where the appropriate ‘curiosity behavior’ matters a lot.
Keywords: Navigation, Curiosity
Contact: [email protected]
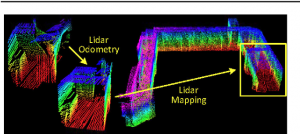
For the Xplore Mars Rover project, knowing the accurate position ( not using GPS ) of the rover is one of the most important and challenging aspect of Xplore Navigation Subsystem. This step is crucial for our path planner , the mapping of the environment and our motor controller. So far we use a IMU and encoder, but those solutions cannot detect slips and can output wrong position estimations.
The goal of this project is to use only the 3d point cloud generated from our 3d Lidar (Ouster OS1 64) to estimate the rover position. The current state of the art method is called LOAM (see ref.) but it is hard to compute and to calibrate. Recently Deep Learning approaches (CNN taking as input 2 consecutive scans , LSTM on the all sequence , etc … ) have showed promising results, but often lacked of an appropriate dataset.
In this project you will design a supervised learning model to estimate the position of the rover given a sequence of 3d LiDar scans.
Reference documents:
[1] LOAM:https://www.youtube.com/watch?v=8ezyhTAEyHs
https://www.researchgate.net/publication/282704722_LOAM_Lidar_Odometry_and_Mapping_in_Real-time
[2] LodoNet : https://arxiv.org/abs/2009.00164
Keywords: Deep Learning, Odometry, 3D LiDAR
Contact: [email protected]
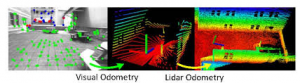
For the Xplore Mars Rover project, knowing the accurate position ( not using GPS ) of the rover is one of the most important and challenging aspect of Xplore Navigation Subsystem. This step is crucial for our path planner , the mapping of the environment and our motor controller. So far we use a IMU and encoder, but those solutions cannot detect slip and can output wrong positions estimations.
Unfortunately 3D LiDar are extremely expensive and it is a known fact that stereo cameras can with some degree replace LiDars ( less precise and more prone to perturbations ). The goal of this project is to use the stream of stereo cameras image pair to estimate the position of the rover.
In this project you will design a model to estimate the position of the rover given a sequence of 360 stereo image pairs.
Reference documents:
[1] VINET : https://arxiv.org/abs/1701.08376
Keywords: Deep Learning, Odometry, Stereo Cameras
Contact: [email protected]
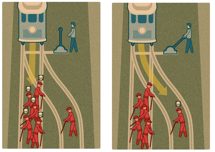
Self-driving cars, self navigating trams, or any intelligent Transportation Systems (ITS) will have to make decisions that can affect humanity. Which actions should a self-driving vehicle take in critical scenarios such as crashing against a wall to avoid collision with a group of kids? What are the ethical impacts of the actions that we (researchers) are automating in the design of intelligent transportation systems?
In this project, the student needs to identify this pandora’s box of research questions regarding ethical impacts of developing ITS. (S)He will develop a platform similar to the MIT moral machines by 1) building a crowd-sourced picture of human opinion on how machines should make decisions when faced with ethical dilemmas in ITS, and 2) crowd-sourcing assembly and discussion of potential scenarios of moral consequence.
Contact: [email protected]
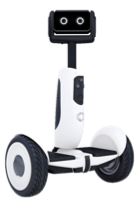
In this project, the student will study existing path planning algorithms (e.g., RL based methods) that enable social robots navigate complex environments such as crowded corridors or even race with humans. (S)He will work with our Segway robotic platform named loomo:
https://actu.epfl.ch/news/our-robot-interacting-with-vip-visitors-in-autonom/
https://www.youtube.com/watch?v=3AnXPqoIfvU&feature=emb_title
Contact: [email protected]
Imitation learning (IL) and reinforcement learning (RL) have been two dominant paradigms for data-driven planning / control for decades, yet they both have fundamental shortcomings: IL policies are inherently limited by imperfect human demonstrations; RL trial-and-errors often raise significant cost and safety concerns. Given a set of human driving experience, can machines learn to drive even better than human teachers? Offline reinforcement learning is a reviving framework that holds tremendous promise for making it possible [1]. In this project, we will explore this exciting area of research in the context of autonomous driving [2].
Reference: [1] Offline Reinforcement Learning: From Algorithms to Practical Challenges, 2020, [2] CrowdNav, 2019
Prerequisite: fluent in Pytorch / Tensorflow, passionate about research / open problems, familiar with RL basics
Contact: [email protected]
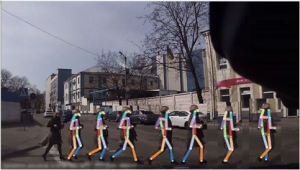
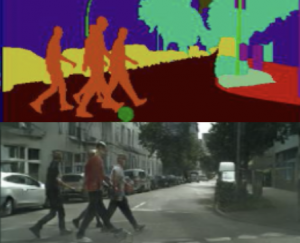
One of the most challenging tasks for a self-driving vehicle when it sees a pedestrian is to predict not only the intention but also his location as early as possible. In this project, the student should study deep learning methods (e.g., CNN with attention mechanisms, LSTM) to predict the intention of the person. They should also investigate proper metrics for evaluation. The method can be used for early warning systems.
In the first step, we try to improve the intention prediction by a side-task which is a bounding box prediction, then we use other side-tasks such as pose prediction.
Predicting the pose can also be useful in decision making of disable people.
Related paper:
- S. A. Bouhsain, S. Saadatnejad, A. Alahi: “Pedestrian Intention Prediction: A Multi-task Perspective”, Arxiv 2020
Keywords: Forecasting, CNN/RNN
Contact: [email protected]

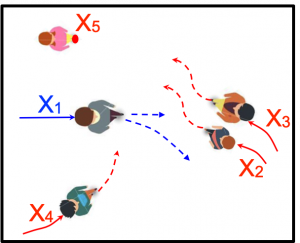
Forecasting pedestrians’ behaviors around self-driving cars is essential for safety, but is one of the most challenging tasks. We suggest that predicting when a pedestrian will walk or stand still using visual cues is at the right trade-off level between annotation requirement for learning and behavior analysis information. In this project, the student will formally define the task of Pedestrian Stop & Go Forecasting, and setup the learning problem from existing datasets. The student will then evaluate simple baselines and adapt existing approaches to this problem.
Keywords: Pedestrian Behavior, Forecasting, Convolutional Neural Network, Recurrent Neural Network,
Contact: [email protected]

Can self-driving cars “drive” the same as humans? Is this dream going to come true?
Learning how to drive/predict from sensors’ inputs is one of the main building blocks of self-driving systems. In this project we use existing datasets to learn human driving behavior. However, it requires addressing multiple exciting challenges. The three main challenges are defined as three sub-projects as follows :
- Causal learning. Causal learning has become a hot topic in recent years. This is due to the fact that neural networks tend to use “any” clue that helps them decrease the loss, and sometimes the leveraged clues are totally irrelevant to the task from a human point of view. The goal of this project is to first analyze existing models in learning correct causal relations, then, to study a causal model structure. Here are two related works: 1, 2.
- Generalizability. is a key goal in data-driven models. However, neural networks highly depend on the training data and perform relatively poorly on out-of-distribution samples. In this project we try to improve the model’s generalizability by different approaches, such as this work.
- Knowledge injection. Neural networks learn policies from data, however, there exist many types of knowledge which can be injected to the network to improve performance and generalizability. For instance, how can we teach networks to respect road boundaries, or to avoid collisions. This line of work is adding knowledge to the neural networks. More info.
Keywords: Prediction / planning,, generalization, causal learning, knowledge injection
Contact: [email protected]
Self-driving or assisted-driving vehicles should not only have a thorough understanding of the current situation, but also forecast the future states. The forecasting step is essential for planning the right actions, avoiding dangerous situations, and raising early enough warnings.
In this project, the student will benchmark new state-of-the-art designs of forecasting algorithms that learn to predict the motion behavior of humans. The student will focus on building on top of the already well-established TrajNet++ framework on the following areas:
-
- Interaction and Sequence Modelling: The student will explore new sequence modelling architectures to better model human motion and social interactions. The student can also extend current models to better improve generalization / transferability of models. (Possibility of a publication.)
- Multimodality: Human motion is inherently multimodal: given a past history of human motion paths, multiple socially plausible futures are possible. Training neural networks for forecasting based solely on minimization of L2 loss leads to the model outputting the mean of all the possible outcomes. In this project, students will explore methods to model complex multimodal distributions. (Possibility of a publication.)
- Extending TrajNet++ with Cues and Datasets: Students will focus on extending TrajNet++ with additional cues like scene information, head orientation and newly released datasets. Strong python/Pytorch coding is a strong requirement.
Reference papers:
Interaction and Sequence Modelling:
- Alahi, Alexandre et al. “Social LSTM: Human Trajectory Prediction in Crowded Spaces.” 2016 IEEE Conference on Computer Vision and Pattern Recognition (CVPR) (2016)
- Vemula, Anirudh et al. “Social Attention: Modeling Attention in Human Crowds.” 2018 IEEE International Conference on Robotics and Automation (ICRA) (2018)
- Giuliari, Francesco et al. “Transformer Networks for Trajectory Forecasting.” ArXiv abs/2003.08111 (2020)
Multimodality
- A. Gupta; j. Johnson; l. Fei-Fei; S. Savarese; A. Alahi : Social GAN: Socially Acceptable Trajectories with Generative Adversarial Networks. CVPR 2018.
- Javad Amirian and Jean-Bernard Hayet and Julien Pettre : Social Ways: Learning Multi-Modal Distributions of Pedestrian Trajectories with GANs, CVPR Workshop 2019
- Liang et al. The Garden of Forking Paths: Towards Multi-Future Trajectory Prediction
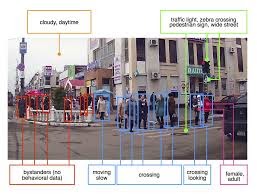
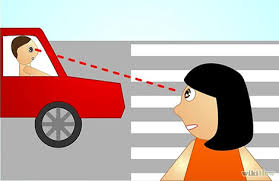
The ability to predict pedestrian behavior at crossroads is crucial for road safety, traffic management systems, Advanced Driver Assistance Systems (ADAS), and more broadly autonomous vehicles. In particular, knowing in advance whether pedestrians will cross the road in front of the vehicles is a major concern.
In this project, the student will study and implement (in PyTorch) several approaches from the literature to complete this task. Several evaluation metrics will be proposed to thoroughly compare all methods.
Related papers:
- T. Mordan; M. Cord; P. Pérez; A. Alahi: Detecting 32 Pedestrian Attributes for Autonomous Vehicles. ArXiv 2020. (link)
- H. Razali; T. Mordan; A. Alahi:Pedestrian Intention Prediction: A Convolutional Bottom-Up Multi-Task Approach. 2020. (link, github)
Keywords: Advanced Driver Assistance Systems, Autonomous Vehicles, Pedestrian Intention Prediction, Human Behavior Analysis
Contact: [email protected]
In the Xplore Mars Rover, so far our local and global planner depend on the accuracy our of 3D LiDar sensor to detect obstacles. Unfortunately our LiDar has a min-range of 1m, and close obstacles are a terrifying threat. Even worst we do not take into consideration the types of soils the rover could be on ( sand, wet sand, rocks, leafs, etc.. ), which risk to over-use the resources of the rover.
The aim of this project is to improve our local planner not to depend solely on the LiDar but to use the current speed, weight distribution, angles of the rover joints, etc ….
In this project you will train a reinforcement learning model to adapt the rover local planner to handle obstacles (ex: rocks, holes , …) as well as different types of soil (ex: sand , gravel …)
Reference documents:
[1] https://leggedrobotics.github.io/rl-blindloco/
Keywords: Reinforcement learning, Navigation
Contact: [email protected]
Many interesting datasets for 3D object detection have been recently launched: KITTI, NuScenes, Waymo, Argo, Lyft, A2D2, and more. Each one has different characteristics (here an overview), so there is no guarantee that an algorithm trained on a dataset will perform well in the real world.
In addition, the performances of state-of-the-art algorithms are evaluated using standard metrics, averaging over all the results of the val/test set. How well existing algorithms will perform in difficult cases? For example, an algorithm is able to predict the 3D distance of people walking in the street. But what happens if a person is lying down in the street?
In this project, S(he) will study cross-dataset generalization and / or new metrics to assess the long tail of perception for humans. (S)he will also evaluate common algorithms using the newly proposed metrics to see how they perform when tested on difficult instances.
Related Paper and GitHub:
L. Bertoni, et al., MonoLoco: Monocular 3D Pedestrian Localization and Uncertainty Estimation, ICCV 2019
Project requirement: experience with Python, interest in Data Science or Computer Vision
Contact: [email protected] to customize this project based on your interest
The past years have witnessed a race for more affordable depth sensors by compromising resolution. Yet, the reduced resolution is limiting the range of applications. In this work, we will study how Deep Generative models (e.g., GAN) can be used to reconstruct high resolution depth map given the combination of a low resolution sensor augmented with an RGB image.
Contact: [email protected]
How far can we push the limits of 3D reconstruction? Can a deep learning method estimate the ring size of a finger given a single image? In this project, the student will study 3D reconstruction of deformable objects like hands, human body… While affordable depth sensor can reconstruct objects with few mm accuracy, (S)He will investigate how to increase the accuracy to less than 0.5 mm given multimodal data (RGB-D).
Contact: [email protected]
Multi-Task Learning aims to transfer learned knowledge between multiple tasks to yield better overall performance. In cases with only one task of interest, it is still possible to leverage all other annotations available, that we call auxiliary supervision, to optimize the results on that one main task. In this project, the student will study how to combine auxiliary information in order to maximize the transfer from auxiliary tasks to the main one. It will be applied on several Computer Vision tasks, in the context of scene understanding.
Related paper:
- T. Mordan; N. Thome; G. Henaff; M. Cord: Revisiting Multi-Task Learning with ROCK: a Deep Residual Auxiliary Block for Visual Detection. NeurIPS 2018. (link, github)
Keywords: Multi-Task Learning, Scene understanding, Convolutional Neural Networks
Contact: [email protected]
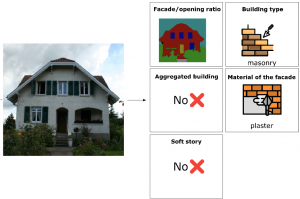
Using image recognition and deep learning techniques, we plan to detect essential features of building envelopes such as building type, the material of the façade and etc. only from images.
The prospective results of the project can be used to develop existing risk or energy models.
In the first step, a small dataset of Switzerland buildings should be annotated. In the second step, a multi-task model is designed and trained on this dataset with some modifications. Finally, we study how a generative model is useful in removing obstacles.
Related paper:
- Kang et al, “Building Instance Classification Using Street View Images”, Arxiv 2018, link
Keywords: CNN, Semantic Segmentation, Multi-task Learning, Envelope feature extraction
Contact: [email protected]

Design an auxiliary task and extend an existing tracklet decoder for longer duration pose tracking in OpenPifPaf.
Strong Python skills required.
Related papers:
[1] PifPaf: Composite Fields for Human Pose Estimation
Contact: [email protected]

Deep generative models have made stunning progress over the past years (for instance take a look at this website: http://thispersondoesnotexist.com). It’s now possible to artificially generate photo-realistic images, arts, audios, videos, and more broadly a large family of high dimensional signals. It paves the way to rethinking data generation, augmentation, and manipulation. There are multiple variations to work on:
- One possibility is to dive into state-of-the-art deep generative models (e.g., Generative Adversarial Networks) to study their performance across various domains and applications (e.g., generate arts, photo-realistic images of humans, music, depth signals).
- The conditional image synthesis does not work the same as unconditional ones. In this project, the goal is to improve the image quality generated by the conditional Generative Adversarial Network (cGAN). We focus on the class of problems where images are generated given semantic inputs, such as scene segmentation masks or human body poses. We want to synthesize images which are realistic and at the same time reasonable in the context that can be useful for virtual tryon, augmented reality, etc.
- Learning a representation for other tasks: Person re-identification is among the most challenging tasks in self-driving cars. This is a hard task because of nuisances such as body poses, illuminations, or changes in camera view-point. Thanks to the advancements in generative models, noticeable improvement in realistic image generation was made, recently. But it still shows some weaknesses, especially where large geometric transformations are appeared and also in low-resolution images. In this work, we will go beyond the classification techniques in person re-identification and study how deep generative models can achieve a hidden view of a pedestrian which is useful for other tasks. We also study how capable they are in learning a disentangled representation.
- …
Related papers:
- O. Gafni, and L. Wolf. “Wish You Were Here: Context-Aware Human Generation.” Proceedings of the IEEE/CVF Conference on Computer Vision and Pattern Recognition. 2020.
- S. Saadatnejad, A. Alahi. “Next Steps for Image Synthesis using Semantic Segmentation”, strc 2020, link
- S. Saadatnejad, A. Alahi. “Pedestrian image generation for self-driving cars”. Strc 2019.
Keywords: Conditional GAN, representation learning, context-aware image synthesis, Deep Generative models, Style transfer
Contact: [email protected]

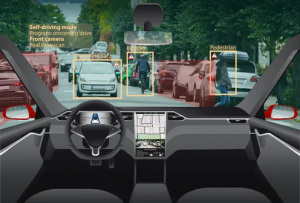
Can autonomous vehicles detect human actions?
Is the person crossing the street distracted?
Is (s)he looking at the phone?
Has (s)he established an eye contact?
Perceiving these actions is crucial to make self-driving cars safe. This project aims to recognize many different actions of people in the context of autonomous driving, by leveraging the great advances of 2D pose estimation algorithms (For example: GitHub)
- Bertoni, et al., MonoLoco: Monocular 3D Pedestrian Localization and Uncertainty Estimation, ICCV 2019
Project requirement: previous experience with Python and PyTorch
Contact: [email protected]
See also section “Earth Observations” below.
Earth Observations
Context :
Coral reefs are suffering a worldwide decline due to the degradation of the marine environment. One of the main causes of this decline are the anomalous heat waves that provoke the death of hard skeleton corals, the cornerstone of the reef ecosystem. As the pace of climate change forecasts stressful conditions to become persistent around the world in the next decades, there is an urgent need in identifying coral populations that are more tolerant to thermal stress. To this end, the seascape genomics approach can be used to investigate adaptation to the environment in coral populations. This approach is at the crossroads between oceanography and populations genomics. To date, the seascape genomics approach relies on publicly available environmental datasets such as those made available by the Copernicus Marine Environment Monitoring System (CMEMS). Data from CMEMS combine remote sensing observations with in-situ records to provide a global scale characterization of ocean conditions (e.g. temperature, salinity, chlorophyll concertation). These products, however, were not conceived to study the biology of marine sessile organisms. One of the main limitations is spatial resolution, which is rarely available at a finer scale than 1 km. This is problematic because a seascape, especially in proximity to the coastline, can display fine-scale structures that can drive adaptive processes in coral populations. Without a higher resolution in the seascape characterization, these adaptive processes cannot be detected with the seascape genomics approach. This master project considers solutions for the issue of mapping corals from above with high resolution remote sensing. In this project, the student will approach the question of high-resolution coral mapping from remote sensing data. Using Landsat 8 and Sentinel 2 satellite images, the presence and density of corals will be characterized with machine learning techniques. Approaches based on feature engineering as random forests and potentially convolutional neural networks (Krizhevsky et al., 2012) will be used for this purpose. The models will be trained on an existing set of coral density reports covering several oceanic regions, which will be matched to remote sensing images (https://www.catlinseaviewsurvey.com/). When trained, the machine learning model will be then deployed on a set of measurements in New Caledonia. When deployed routinely, the developed system could be used to monitor the variation in the seabottom composition and evaluate, for instance, whether specific reefs are gaining or losing coral cover over time. Such information is fundamental, as it might enable to verify whether reefs exposed to recurrent thermal stress are less sensitive to future heat waves.
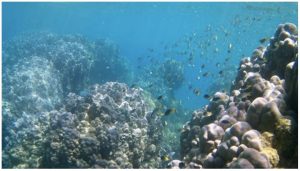
Objectives :
- Gather a remote sensing image collection at the location of records of coral density worldwide
- Develop a machine learning model that predicts the presence of corals and their density from the corresponding satellite image patch
- Provide a map describing changes in coral covers over the last 5 years in the Southern Lagoon of New Caledonia.
Requirements and practical info :
- Background in machine/deep learning is welcome.
- Programming skills in Python.
- The thesis will be supervised from the Sion campus.
- Access to parallel computing resources is provided
Literature :
- Krizhevsky, Alex, Ilya Sutskever, and Geoffrey E. Hinton. “Imagenet classification with deep convolutional neural networks.” Advances in neural information processing systems. 2012.
- Antoine Collin, Jean Laporte, Benjamin Koetz, François-Régis Martin-Lauzer, Yves-Louis Desnos.Mapping bathymetry, habitat, and potential bleaching of coral reefs using Sentinel-2. 13th Interna-tional Coral Reef Symposium (ICRS 2016), Jun 2016, Honolulu, United States. pp.405-420. hal-01460593
- Oliver Selmoni, Estelle Rochat, Gael Lecellier, Veronique Berteaux-Lecellier, Stéphane Joost (2020). Seascape genomics as a new tool to empower coral reef conservation strategies: An example on north-western Pacific Acropora digitifera. Evolutionary Applications, 588228. https://doi.org/10.1111/eva.12944
Contact :
Prof. Devis Tuia, [email protected]
Dr. Stephane Joost, [email protected]
Context :
The Alps are a strong tourism attractor and have major impacts on the local economy of mountain regions. It is therefore important to understand what are the services that the territory can provide to tourists and which areas could be exploited for new cultural and sport activities. Volunteered Geographic Information sources like Flickr are a goldmine for such analysis (Havinga et al., 2020). In this work, the student will create a dataset for uncovering and analysing activities in the Swiss Alps, starting from pairs of images and tags from Flickr. The analysis of the tags will allow identifying groups of activities (skiing, hiking, meditation, ….), that will then be used to train a classification model (for instance, convolutional neural networks, He et al., 2016, Zhu et al., 2017) able to recognize scene attributes – and eventually the activities – in new areas or in a multitemporal setting. The models developed will use either the Flickr images or environmental variables (or both) to recognize the activities. The effect of scale of analysis, as well as of the users’ profile (when available) will also be studied. Using the predictions of the models, the offer of activities will be analyzed and potential new areas highlighted.

Objectives :
- Create a dataset for touristic activities from Flickr in the Swiss Alps
- Train a series of machine learning models to predict the activities
- Map the hotspots of activities.
Requirements and practical info :
- Background in machine/deep learning is welcome.
- Programming skills in Python.
- The thesis will be supervised from the Sion campus.
- Access to parallel computing resources is provided.
Literature :
Havinga, Bogaart, Hein, Tuia (2020), Defining and spatially modelling cultural ecosystem services using crowdsourced data, Ecosys. Serv. Avialable at: https://www.sciencedirect.com/science/article/pii/S2212041620300334- He, Zhang, Ren, Sun (2016), Deep residual learning for image recognition, CVPR. Available at: https://arxiv.org/abs/1512.03385
- Zhu, et al. (2017), Deep learning in remote sensing: a review and future directions, IEEE GRSM. Availble at: https://arxiv.org/abs/1710.03959
Contact :
Prof. Devis Tuia, [email protected]
Context :
Every 6 to 12 years a map of landuse in Switzerland is generated by photointerpretation of aerial imagery. This time consuming work reduces greatly the update time and comes with a very high cost. In this project, you will explore the potential of using modern machine learning (and more specifically deep learning) techniques to automatize this process. Using machine and deep learning is becoming more and more appealing for geospatial mapping, and especially landuse (OFS, 2018). The sheer amount of information gathered by national mapping agencies in the shape of aerial photographs, together with the availability of previous land usage maps generated by photointerpretation in the past, provides the perfect playground to test the suitability of modern deep learning classification and segmentation to automatically generate land use maps at regional scale (Zhu et al., 2017). In this project, the student will implement, train, and evaluate state-of-the-art deep learningbased image classification approaches (e.g. ResNet, He, et al. 2016) to classify aerial imagery into a pre-defined set of land use categories. The model will be trained and calibrated in past photointerpreted campaigns, and then applied to a different time step to assess robustness to changes and illumination conditions. The Swiss Alps will be the area under study. To tackle problems due to acquisition conditions mismatch, strategies rooted in domain adaptation will be considered.
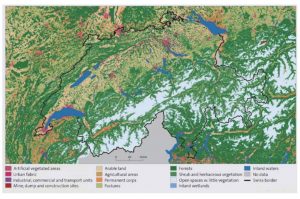
Objectives :
- Familiarise and successfully setup a CNN-based classification prototype pipeline for land use classification in the Swiss Alps.
- Investigate problems related to sensor changes and illumination mismatches between time periods
- Provide recommendations to automatize the process, also focusing on map updates only.
Requirements and practical info :
- Background in machine/deep learning is welcome.
- Programming skills in Python.
- The thesis will be supervised from the Sion campus.
- Access to parallel computing resources is provided.
Literature :
- He, Zhang, Ren, Sun (2016), Deep residual learning for image recognition, CVPR. Available at: https://arxiv.org/abs/1512.03385
- OFS (2018), Feasibility study about the Surface Statistic 2020. Available at:https://www.bfs.admin.ch/bfs/fr/home/statistiques/espaceenvironnement/enquetes/area.assetdetail.5687737.html
- Zhu, et al. (2017), Deep learning in remote sensing: a review and future directions, IEEE GRSM. Availble at: https://arxiv.org/abs/1710.03959
Contact :
Prof. Devis Tuia, [email protected]
Context :
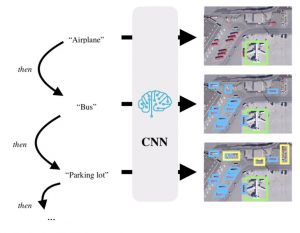
The automated detection of objects in aerial images is an important asset for many fields, ranging from operational safety in air traffic control to land use assessments. Agencies in these fields typically require the identification of multiple types of objects in a scene, but often do not have all data available from the start. In this project, you will develop machine learning solutions for object detection that can be trained to recognise different types of objects by means of incremental learning on multiple data sets. Recent years have seen a tremendous rise in using machine learning models for object detection, mainly through deep learning (Krizhevsky et al., 2012; Lin et al., 2017). In particular, deep convolutional neural networks (CNNs) are often trained on large training data sets that are expensive to acquire. Even more limiting, large-scale training data are often not readily available for remote sensing applications, and it is often impossible to train a CNN-based detector that can find all object types of interest (airplanes, buses, etc.; cf. Figure 1) at once in an image. In this project, the student will investigate ways to overcome this problem. By training a deep learning detector on multiple data sets in a row, the model is able to learn about a new class each time without forgetting the previously learned object types. This is known as “lifelong learning” (Srivastava et al., 2019).
Objectives :
- Search for and gather a dataset for multiples objects detection issued from several aerial imaging benchmarks
- Familiarise with deep learning and successfully set up a CNN-based object detection training and testing pipeline for remote sensing images.
- Investigate lifelong learning-based approaches to train detectors sequentially on multiple types of objects, and data sets.
- Provide detection results, accuracy assessments, and comparisons to non-sequential baselines.
Requirements and practical info :
- Background in machine/deep learning is welcome.
- Programming skills in Python.
- The thesis will be supervised from the Sion campus.
- Access to parallel computing resources is provided.
Literature :
- Krizhevsky, Alex, Ilya Sutskever, and Geoffrey E. Hinton. “Imagenet classification with deep convolutional neural networks.” Advances in neural information processing systems. 2012.
- Lin, Tsung-Yi, et al. “Focal loss for dense object detection.” Proceedings of the IEEE international conference on computer vision. 2017.
- Srivastava, Shivangi, et al. “Adaptive Compression-based Lifelong Learning.” arXiv preprint arXiv:1907.09695 (2019).
Contact :
Prof. Devis Tuia, [email protected]
Context :
Deep Learning models like Convolutional Neural Networks (CNN) are ubiquitous across all major computer vision tasks, such as self-driving cars or object detection in images. In parts, this is due to CNNs learning a classifier and expressive features together on large amounts of training data. This generally fails for applications where only little annotated data is available. In this project, we intend to overcome this issue by employing techniques that pre-train CNNs for free. Conventionally, CNNs are composed of a part that performs feature extraction (i.e., encoding each data point into a high-dimensional vector that summarises it appropriately), as well as a classifier that provides a prediction with reasoning based on said feature vectors. Due to the millions of parameters, such models require equally many training examples, which may not always be available. Although transfer learning (i.e., pre-training a CNN on another task where data availability is high) is often employed to address this limitation, it typically does not solve it. A recent attempt to make CNNs ready for the final task is Self-Supervised Learning (SSL), where the model is pre-trained on the target data, but with labels that come for free. An example for this is the prediction of colour images from a greyscale input. The hope is that such models yield feature vectors that effectively summarise the image content appropriately, and thus only need little actual training data for the final task (e.g., object detection). In this project, the student will investigate the feasibility of using SSL for wildlife detection in aerial images with CNNs. This task is particularly arduous in that labels are difficult and expensive to obtain. Instead, the student will first experiment with SSL techniques, such as deep clustering (cf. references) to pre-train the model. In a second step, the pre-trained model will be subjected to the task of wildlife detection, based on only few amounts of training data. If successful, the model will yield similar performances to counterparts that were trained on orders of magnitude more labels.
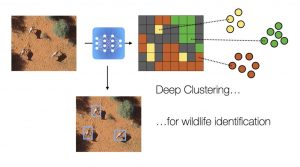
Objectives :
- Familiarise and successfully set up a CNN-based object detector for animal localisation in UAV images
- Investigate the possibilities of using SSL tasks like deep clustering for model pre-training in object detection
- Provide an animal detector that, if pre-trained with SSL, yields detection performances similar to models trained with more labels
Requirements and practical info :
- Background in machine/deep learning is welcome.
- Programming skills in Python.
- The thesis will be supervised from the Sion campus.
- Access to parallel computing resources is provided.
Literature :
- Kellenberger, Benjamin, Diego Marcos, and Devis Tuia. “Detecting mammals in UAV images: Best practices to address a substantially imbalanced dataset with deep learning.” Remote Sensing of Environment 216 (2018): 139-153.
- Caron, Mathilde, et al. “Deep clustering for unsupervised learning of visual features.” Proceedings of the European Conference on Computer Vision (ECCV). 2018.
- Doersch, Carl, and Andrew Zisserman. “Multi-task self-supervised visual learning.” Proceedings of the IEEE International Conference on Computer Vision. 2017.
Contact :
Prof. Devis Tuia, [email protected]
Context :
Wildlife censuses play a vital role in monitoring endangered species, such as rhinos. Such censuses are increasingly conducted by means of animal detection in aerial images, captured with drones. However, the large number of images that are needed bears a significant burden, due to the requirement for tediously drawn bounding boxes around the oftentimes minuscule and rare animals in the images. In this work, we attempt to solve this problem by means of automated animal detection through state-of-the-art deep learning models, trained on synthetically rendered animals. With the advent of deep learning, in particular Convolutional Neural Networks (CNNs), machine vision tasks like object detection and classification have seen tremendous progress and rise in various fields, such as person identification or autonomous driving. In the context of wildlife conservation, CNNs have successfully been employed to detect large mammals, such as zebras or rhino, in images acquired from an aerial point of view, e.g. with drones. However, CNNs require a large amount of training data, which requires extensive amounts of work to create—basically, many hundreds of images need to be manually screened and bounding box annotations be drawn for thousands of animals therein. In this project, the student will instead explore the possibilities of training CNNs for wildlife detection on artificially rendered data. In an initial step, this requires setting up a deep learning infrastructure and obtaining a baseline performance estimate on real, labelled images (provided). In a second step, the student will explore ways of rendering and positioning animals in the aerial image and training a CNN to detect it. This model is then to be applied on the real images. If successful, the end-result will be an animal detector that works sufficiently well on real images but requires no or very little manually annotated training images.
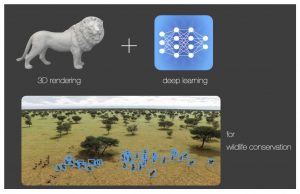
Objectives :
- Familiarise and successfully set up a CNN-based object detector for animal localisation in UAV images
- Investigate the possibilities of using 3D rendering engines for realistic wildlife visualisations and detector training
- Provide an animal detector that is trained on synthetically rendered examples and can detect animals in real aerial images
Requirements and practical info :
- Background in machine/deep learning is welcome.
- Programming skills in Python.
- The thesis will be supervised from the Sion campus.
- Access to parallel computing resources is provided.
Literature :
- Kellenberger, B., Marcos, D. and Tuia, D. “Detecting mammals in UAV images: Best practices to address a substantially imbalanced dataset with deep learning.” Remote Sensing of Environment 216 (2018): 139-153.
- Lin, T.-Yi, et al. “Focal loss for dense object detection.” IEEE International Conference on Computer Vision, 2017.
- Zuffi, S., et al. “3D Menagerie: Modeling the 3D Shape and Pose of Animals.” IEEE Conference on Computer Vision and Pattern Recognition, 2017.
Contact :
Prof. Devis Tuia, [email protected]
Context :
Camera Traps (CTs) are highly versatile instruments to record presence and abundance of wildlife species in their habitat. Although they are conventionally motion-triggered and thus should only acquire images whenever an animal passes in front of the view, this mechanism still results in many empty images (where no animal is present). Recent developments have seen increased usage of machine learning models, in particular Convolutional Neural Networks (CNNs), to automatically classify individuals in CT imagery. CNNs are able to provide high-accuracy predictions and can process large amounts of data in reasonable time, which makes them predestined for the deluge of CT imagery, oftentimes in the millions of images. Conventionally, CNNs need to be initialized with a predefined list of label classes (in our case, species) it can predict. However, some applications may require the expansion of this list, for example in the case of species re-introductions to a habitat, or adaptation of the model to other habitats. For example, a CNN trained to detect ibexes in the Alps will likely miss e.g. bears that occasionally roam in the region, if it has not been provisioned with a dedicated “bear” class. In this work, we attempt to overcome this problem by training a CNN that can learn to adapt to new species. To do so, the student first trains a CNN on a subset of species in a curated data set of CT imagery, coming from the Swiss National Park (SNP). To make the CNN cope with the different species of this data set, the student will investigate methodologies like class additions based on neuron re-weighting. Focus will be laid on (a.) ensuring the addition of new classes does not bring the trained model out of balance, and (b.) investigations on the number of examples required to incorporate the new species. If successful, the end result will be a CNN-based classifier for CT imagery that can incorporate new species in a sequential way and only requires a small amount of images to obtain satisfactory accuracy, also for the new classes.
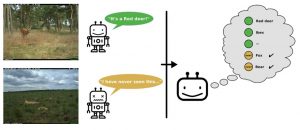
Objectives :
- Familiarise and successfully set up a CNN for wildlife classification in CT imagery
- Investigate the possibilities of class additions for training deep learning models
- Provide a CNN that can classify species in CT imagery and can be expanded to new species with a limited amount of training data
Requirements and practical info :
- Background in machine/deep learning is welcome.
- Programming skills in Python.
- The thesis will be supervised from the Sion campus.
- Access to parallel computing resources is provided.
Literature :
- Krizhevsky, Alex, Ilya Sutskever, and Geoffrey E. Hinton. “Imagenet classification with deep convolutional neural networks.” Advances in neural information processing systems. 2012.
- Qi, Hang, Matthew Brown, and David G. Lowe. “Low-shot learning with imprinted weights.” Proceedings of the IEEE conference on computer vision and pattern recognition. 2018.
Contact :
Prof. Devis Tuia, [email protected]
Alfonso Ferrone and Gionata Ghiggi
In polar regions, aviation and maritime operations safety can be hampered by many hazardous meteorological phenomena. In Antarctica, ice-fog can develop in a very short time and disrupt transportation as well as research operations. Despite ice-fog formation and dynamics have been a topic of scientific research for years (Ricaud et al, 2012, 2017), the phenomenon is currently poorly monitored and understood because of lack of ground-monitoring weather stations/instruments (i.e. LIDAR) and the inability of current operational numerical weather prediction (NWP) models to forecast its occurrence. The reason is that ice-fog develops because of a complex interplay of surface radiative fluxes and small-scale atmospheric boundary layer processes (Argentini et al., 2005) which are not adequately parametrized in the NWP models.
In this Master Thesis, we aim to investigate the possibility of creating an ice-fog monitoring system using multispectral satellite imagery from polar low Earth orbit (LEO) imaging sensors (i.e. the Moderate Resolution Imaging Spectroradiometer – MODIS). These LEO sensors have an imaging swath of thousands of kilometers and they overpass the poles approximately every 100 minutes, which would allow the development of a fog-monitoring system with sub-hourly frequency for the entire Antarctic continent.
Snow/fog/cloud detection from passive optical satellite imagery is a long-standing challenge in the remote sensing community. The poor visible (VIS) and thermal (NIR) contrast between fog/clouds and the underlying snow/ice surface, the small radiances from the cold polar atmosphere, and the ubiquitous temperature and humidity inversions in the lower troposphere. Additionally, snow reflectance shows high diurnal variability because of snow-melting and changing snow optical properties.
To overcome these difficulties, we have already developed an innovative approach (referred to as ParametricUMAP – PolyClassifiers) that allows us to distill the information hidden in the multispectral imagery and improve snow/cloud detection over existing operational products (see Figure 1). ParametricUMAP (Sainburg et al., 2020) is a non-linear dimensionality reduction algorithm designed for efficient feature extraction from large datasets by combining the powerful mathematical topology concepts of UMAP (McInnes et al., 2020) with the flexibility and computational benefits provided by neural networks. The features extracted using ParametricUMAP are then ingested by the PolyClassifiers: a computational object equipped with a graphic user interface, which facilitates image segmentation with weakly supervision in an active learning context.
We expect the student to improve the existing framework to enable robust and accurate fog detection!
Objectives
- Improve the ParametricUMAP-PolyClassifiers GUI
- Develop a robust ice-fog detection pipeline using the ParametricUMAP – PolyClassifiers framework
- (Optional): Adapt the ice-fog detection pipeline to LEO imaging sensors with various spectral bands configuration
Requirements
- Good programming skills in python
- Experience in Image processing and machine learning
References
- Argentini, S., Viola, A., Sempreviva, A. M., and Petenko, I. (2005). Summer boundary-layer height at the plateau site of Dome C, Antarctica, Boundary-Layer Meteorology, 115, 409–422.
- McInnes, ; Healy, J.; Melville, J. (2020). UMAP: Uniform Manifold Approximation and Projection for Dimension Reduction. Available at: https://arxiv.org/abs/1802.03426
- Ricaud, , Genthon, C., Durand, P., Attié, J.-L., Carminati, F.,Canut, G., Vanacker, J.-F., Moggio, L., Courcoux, Y., Pellegrini,A., and Rose, T. (2012). Summer to Winter Diurnal Variabilities of Temperature and Water Vapor in the lowermost troposphere as observed by the HAMSTRAD Radiometer over Dome C, Antarctica, Boundary-Layer Meteorology, 143, 227–259.
- Ricaud, P., Bazile, E., del Guasta, M., Lanconelli, C., Grigioni, P., & Mahjoub, A. (2017). Genesis of diamond dust, ice fog and thick cloud episodes observed and modelled above Dome C, Antarctica. Atmospheric Chemistry and Physics, 17(8), 5221.
- Sainburg, T.; McInnes, L.; Gentner, T.Q. (2020). Parametric UMAP: learning embeddings with deep neural networks for representation and semi-supervised learning. Available at: https://arxiv.org/abs/2009.12981
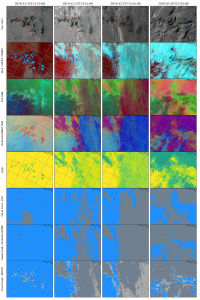
Figure 1. Examples of snow/fog/cloud discrimination with false-color RGB composites and comparison between the operational MODIS MYD35_L2 and the proposed ParametricUMAP – PolyClassifiers cloud masks. Cloud masks depict the cloud cover in gray. Light gray color in the MYD35_L2 cloud mask represents an uncertain cloud cover.
The proposed Master Project aims to assess the possible relationship between the proportions of solid hydrometeors in the vertical column and the precipitation intensity at the surface. In Switzerland and in complex terrain more generally, weather radars are usually located on top of the highest mountains. Most often, the radars are therefore located above the freezing level or can only scan the solid phase of precipitating clouds. In such situations, the scattering of the radar signal by solid hydrometeors is highly variable and make quantitative precipitation estimation (QPE) challenging. Classical statistical parametric approaches (i.e., Z-R relationships) cannot deal with the highly non-linear interactions between equivalent rain rate and polarimetric radar measurements. The use of non-parametric models (i.e. multidimensional look up tables) is thus appropriate:
* To estimate the possible link between solid hydrometeors aloft and the reflectivity of liquid precipitation at low-levels,
* To improve the accuracy of rain rate retrievals at the ground.
A preliminary exploratory data analysis (Fig. 1) suggests that a high proportion of rimed particles (RP) in the vertical column is associated to intense precipitation events. Large amounts of aggregates (AG) occur instead during rainfall events with moderate intensity and a prevalence of crystals (CR) is observed at the margins of the precipitating systems.
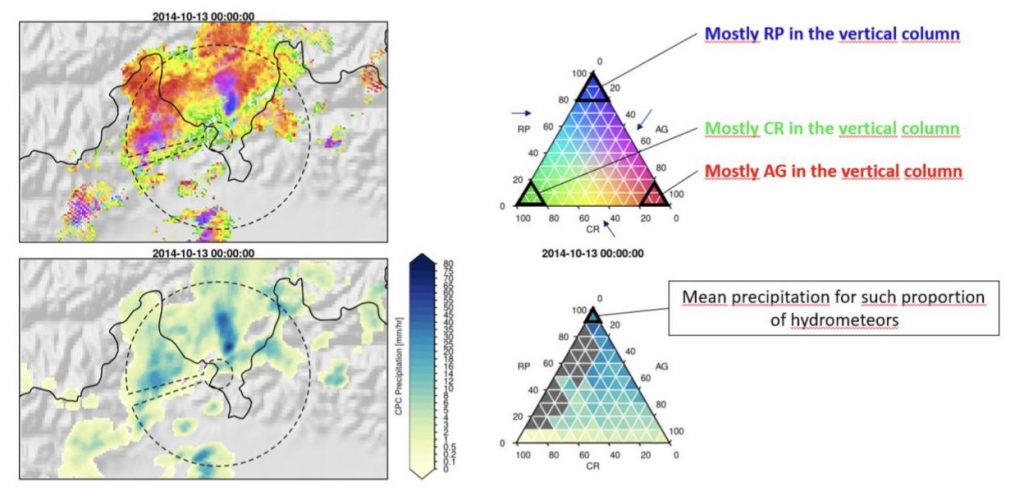
Fig 1. Cofluctuation between the proportion of solid hydrometeors in the vertical column and precipitation rate estimated at the ground.
The student will exploit five years of polarimetric measurements of the operational MeteoSwiss Rad4Alp C-band weather radar network to better characterize the spatio-temporal variability of this relationship, paving the way for a new QPE methodology in mountainous regions.
In a first step, the student will build-up a database of precipitation events focusing on a specific region of interest. Then he will start to characterize the above-mentioned cofluctuation between the proportion of solid hydrometeors in the vertical column and reflectivity of liquid precipitation at low-levels using multivariate visualization techniques. Finally, based on the insights obtained from the exploratory data analysis, it will decide the more appropriate methodology (i.e. multivariate lookup
table, convolutional neural network along the vertical columns, …) to retrieve low-level reflectivity of liquid precipitation or directly precipitation rates at the ground.
Objectives
* Establish the link between the solid proportion of hydrometeors and surface precipitation
* Develop a statistical algorithms for rainfall rate retrievals.
Requirements
* Good coding skills in R / Python
* Interest for exploratory data analysis and visualization
* Basic knowledge of statistics and machine learning
Contact: [email protected]
ET is the sum of the water lost to the atmosphere from plant tissues via transpiration and that lost from the land surface elements, including soil, plants and open water bodies, through evaporation. Processes controlling ET play a central role in linking the energy (latent heat), water (moisture flux) and carbon cycles (photosynthesis–transpiration trade-off) in the Earth system. Over 60 % of precipitation on the land surface is returned to the atmosphere through ET and the accompanying latent heat (λET) (λ is the latent heat of vaporization) accounts for more than half of the solar energy received by the land surface. ET is also an important parameter controlling hydrological extreme events, when considering the development of heatwaves and flash droughts, through coupling with soil moisture process. Additionally, key impact variables such as irrigation water demand or agricultural productivity are physically controlled by the partitioning of energy at the land surface, which largely depends on ET. Furthermore, ET is also coupled with the carbon dioxide (CO2) exchange between the canopy and the atmosphere through vegetation photosynthesis.
Despite its relevance, ET is the less monitored variable of the water cycle, with a few hundred ET measurements from FLUXNET eddy covariance towers around the world. Additionally, no representative measurements are available at large spatial scales, such the ones employed by global hydrological models (GHMs) which runs with grid-cell resolution of tens of kilometers. Consequently, ET remains the most poorly constrained component of the global hydrological cycle, with large uncertainty in its spatial and temporal variability (Fig. 1), despite extensive research (Mueller et al., 2013; Miralles et al., 2016; Wartenburger et al., 2018).
Accurate global gridded estimates of ET are therefore highly needed to improve the understanding of terrestrial water, carbon, and surface energy exchanges, in addition to being required for model evaluation and development of climate projection of water resources and agricultural productivity.
Current methods to constrain ET fluxes can be summarized as:
* Physics-based ET parametrizations (i.e. Penman‐Monteith, Priestley‐Taylor or Hargreaves equations) in GHMs
* Simplified physics-based process models combined with remote sensing land-surface reflectance in the VIS/IR range for parameter estimations (Zhang et al., 2010) such as GLEAM (Miralles et al., 2013)
* Empirical vegetation index – ET relationships (i.e. NDVI-ET, SIF-ET)
* Surface energy balance (SEB) approaches based on thermal (IR) remote sensing
* Upscaling FLUXNET ET point-scale measurements using machine learning and satellite VIS/IR reflectance and climate data as predictors (FLUXCOM)(Jung et al., 2019)
* Multi-model synthesis/combinations of ET datasets: LandFLUX (Mueller et al., 2013), DOLCE (Hobeichi et al. 2018)
This Master Thesis Projects aims at creating a global reconstruction of monthly terrestrial evapotranspiration (ET) rates via the water balance equation, which is defined as
ΔTWS/Δt = P(t) – ET(t) – R(t) à ET(t) = P(t) – R(t) – ΔTWS/Δt
with the terrestrial water storage (TWS) that can be constrained by GRACE-REC (Humphrey et al., 2019); the runoff flux that can be constrained by GRUN (Ghiggi et al., 2019); and the precipitation flux (P) that can be derived from satellites or atmospheric reanalysis. The new ET dataset will then be benchmarked against the independent FLUXNET-ET measurements as well as a large set of ET products either derived from satellite data or GHMs simulations. Finally, once observations-based ET estimates are derived and validated for the full globe by means of the water balance equation, the student will be able to train a ML algorithm to establish a link between observed ET dynamics to a set of predictors such past monthly precipitation and monthly temperature, following an approach like the one detailed in Ghiggi et al., 2019. This will allow the generation of century-long ET reconstructions, fostering the understanding of freshwater dynamics and climate variability.
Objectives
* Production of a new ET-dataset using GRUN and GRACE-REC by means of the water balance equation
* Development of a machine learning model to predict monthly ET as function of predictors such past precipitation and temperature
* Benchmarking against current state-of-the art ET products (i.e. LANDFLUX, GLEAM, FLUXCOM, …)
Requirements
* Basic knowledge in hydrology and statistics
* Good programming skills in python or R
References
Ghiggi, G., Humphrey, V., Seneviratne, S. I., and Gudmundsson, L.: GRUN: an observation-based global gridded runoff dataset from 1902 to 2014, Earth Syst. Sci. Data, 11, 1655–1674, https://doi.org/10.5194/essd-11-1655-2019, 2019.
Hobeichi, S., Abramowitz, G., Evans, J., and Ukkola, A.: Derived Optimal Linear Combination Evapotranspiration (DOLCE): a global gridded synthesis ET estimate, Hydrol. Earth Syst. Sci., 22, 1317–1336, https://doi.org/10.5194/hess-22-1317-2018, 2018.
Humphrey, V. and Gudmundsson, L.: GRACE-REC: a reconstruction of climate-driven water storage changes over the last century, Earth Syst. Sci. Data, 11, 1153–1170, https://doi.org/10.5194/essd-11-1153-2019, 2019.
Jung, M., Koirala, S., Weber, U. et al. : The FLUXCOM ensemble of global land-atmosphere energy fluxes. Sci Data 6, 74, https://doi.org/10.1038/s41597-019-0076-8, 2019.
Miralles, D. G., Holmes, T. R. H., De Jeu, R. A. M., Gash, J. H., Meesters, A. G. C. A., and Dolman, A. J.: Global land-surface evaporation estimated from satellite-based observations, Hydrol. Earth Syst. Sci., 15, 453–469, https://doi.org/10.5194/hess-15-453-2011, 2011.
Miralles, D. G., Jiménez, C., Jung, M., Michel, D., Ershadi, A., McCabe, M. F., Hirschi, M., Martens, B., Dolman, A. J., Fisher, J. B., Mu, Q., Seneviratne, S. I., Wood, E. F., and Fernández-Prieto, D.: The WACMOS-ET project – Part 2: Evaluation of global terrestrial evaporation data sets, Hydrol. Earth Syst. Sci., 20, 823–842, https://doi.org/10.5194/hess-20-823-2016, 2016.
Mueller, B., Hirschi, M., Jimenez, C., Ciais, P., Dirmeyer, P. A., Dolman, A. J., Fisher, J. B., Jung, M., Ludwig, F., Maignan, F., Miralles, D. G., McCabe, M. F., Reichstein, M., Sheffield, J., Wang, K., Wood, E. F., Zhang, Y., and Seneviratne, S. I.: Benchmark products for land evapotranspiration: LandFlux-EVAL multi-data set synthesis, Hydrol. Earth Syst. Sci., 17, 3707–3720, https://doi.org/10.5194/hess-17-3707-2013, 2013.
Pan, S., Pan, N., Tian, H., Friedlingstein, P., Sitch, S., Shi, H., Arora, V. K., Haverd, V., Jain, A. K., Kato, E., Lienert, S., Lombardozzi, D., Nabel, J. E. M. S., Ottlé, C., Poulter, B., Zaehle, S., and Running, S. W.: Evaluation of global terrestrial evapotranspiration using state-of-the-art approaches in remote sensing, machine learning and land surface modeling, Hydrol. Earth Syst. Sci., 24, 1485–1509, https://doi.org/10.5194/hess-24-1485-2020, 2020.
Wartenburger, R., Seneviratne, S.I., M. Hirschi, J. Chang, P. Ciais, D. Deryng, J. Elliott, C. Folberth, S.N. Gosling, L. Gudmundsson, A.-J. Henrot, T. Hickler, A. Ito, N. Khabarov, H. Kim, G. Leng, J. Liu, X. Liu, Y. Masaki, C. Morfopoulos, C. Müller, H.M. Schmied, K. Nishina, R. Orth, Y. Pokhrel, T.A.M. Pugh, Y. Satoh, S. Schaphoff, E. Schmid, J. Sheffield, T. Stacke, J. Steinkamp, Q. Tang, W. Thiery, Y. Wada, X. Wang, G.P. Weedon, H. Yang, T. Zhou : Evapotranspiration simulations in ISIMIP2a—evaluation of spatio-temporal characteristics with a comprehensive ensemble of independent datasets. Environ. Res. Lett., 13 (7), 2018.
Zhang, K., J. S. Kimball, R. R. Nemani, and S. W. Running: A continuous satellite‐derived global record of land surface evapotranspiration from 1983 to 2006, Water Resour. Res., 46, W09522, doi:10.1029/2009WR008800, 2010.
Contact: [email protected]
At the Stream Biofilm and Ecosystem Research Laboratory (SBER), we study microbes that live in glacier-fed streams all around the world. We aim to answer questions relating to the loss of these unique habitats as the glaciers are melting because of climate change. An expedition team travels to these remote sites and samples stream biofilms for microbiological and molecular analyses in the lab. Several parameters related to the glacier (e.g. surface area, glacierization of the catchment, distance between the glacier terminus and sampling site, etc.) are important descriptors of the environmental conditions in the glacier-fed streams. We employ remote sensing to obtain these parameters for 200 glacier systems around the world. Students will develop an automated routine that would select the most recent cloud-free and snow-free imagery available, for a region of interest. Currently the imagery used is Sentinel 2, level-2A products. The choice of tool is left to the discretion of the students (Sentinel-2 Toolbox, Google Earth Engine, or any tools of choice)
Contacts : [email protected], [email protected]
Coral reefs are estimated to cover 1% of the sea floor, nevertheless they host one third of the marine wildlife. This is due to the fact that many marine species, across a wide range of taxonomical categories, depend on this habitat for spawning, breeding, feeding, hunting or nursing. It is therefore not surprising that coral reef health shapes the structure and abundance of fish communities and can induce significant bottom-up changes on the planet food chains and biogeochemical cycles. This has a direct impact on the local fishing activities, which is noteworthy since coral reefs are present in more than 100 countries and provide protein supply to tens of millions of people. Besides, coral reefs represent a crucial physical barrier to mitigate the impact of currents, waves and storms on the coastlines, with an economical value estimated up to several millions of dollars.
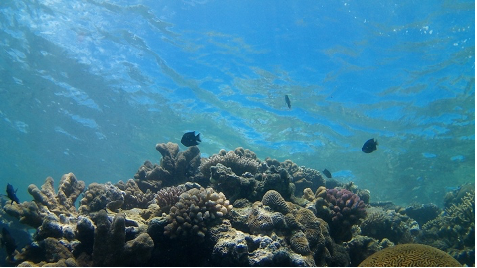
Over the last decades, the degradation of water conditions had caused a severe decline in coral reefs around the world. An important part of this decline is due to global stressors associated with climate change, such as the raise in water temperature and ocean acidification. In particular, the anomalous raise in water temperature causes coral bleaching, a phenomenon that is decimating coral population around the world. Coral reef degradation is also caused by stressors related to local activities. Such stressors can be the wastes of human activities (e.g. industrial, agricultural, urban) or the run-off of sediments produced by coast construction. Human pressure on the reef ecosystem can also be driven by boat traffic from fishing or touristic activities, or from sea transportation.
Remote sensing data offers unprecedented opportunities to characterize the stressors that are causing the decline of coral reefs. For instance, spatial patterns of water temperature variation can be estimated using remote sensing at 1 km resolution for any reef around the world. Furthermore, remote sensing makes it possible to evaluate the land use in coastal areas, and therefore to identify polluting activities and measure their distance from coral reefs.
In this project, the student will learn how to process remote sensing data to characterize the environmental stressors causing coral reefs decline. The focus will be brought on different coral reef regions around the world, where information on the state of the reef is publicly available (https://www.catlinseaviewsurvey.com/). The student will then produce a characterization of the environmental conditions in the different areas. Such characterization will encompass: (1) existing descriptors of water conditions derived from publicly available remote sensing products (e.g. water temperature at 1 km of resolution; (2) new descriptors of water conditions derived from raw remote sensing data; (3) new descriptors of local stressors derived from the remote sensing of land use. The student will investigate the environmental descriptors correlated with changes in the state of coral reef. The most pertinent descriptors will then be used to characterize local stressors of coral reefs the Red Sea, where a transnational project is setting-up at EPFL to study the state of corals of the region.
Contacts
Charlotte Weil, ENAC-IT4R, [email protected]
Oliver Selmoni, LASIG, [email protected]
Prof. Devis Tuia, ECEO, [email protected]
Literature
- Selmoni, O., Lecellier, G., Vigliola, L., Berteaux-Lecellier, V. & Joost, S. Coral cover surveys corroborate predictions on reef adaptive potential to thermal stress. Sci. Rep. 10, 1–13 (2020).
- Maina, J., Venus, V., McClanahan, T. R. & Ateweberhan, M. Modelling susceptibility of coral reefs to environmental stress using remote sensing data and GIS models. Ecol. Modell. 212, 180–199 (2008).
- De’ath, G., Fabricius, K. E., Sweatman, H. & Puotinen, M. The 27-year decline of coral cover on the Great Barrier Reef and its causes. Proc. Natl. Acad. Sci. U. S. A. 109, 17995–9 (2012).
- Cinner, J. E. et al. Bright spots among the world’s coral reefs. Nature 535, 416–419 (2016).
- Ateweberhan, M. et al. Climate change impacts on coral reefs: Synergies with local effects, possibilities for acclimation, and management implications. Mar. Pollut. Bull. 74, 526–539 (2013).
Supercell thunderstorms are among the most dangerous severe weather phenomena. With a recently established multi-year dataset of supercell occurrences in Switzerland, we aim to improve our understanding by utilizing unsupervised machine learning. The dataset provides metrics on the strength and size of the observed supercell and can be extended with information on terrain, location and synoptic weather situation. To interpret the data and extract patterns in the occurrence of supercells, we aim to employ unsupervised learning techniques. These can be approached from a lifecycle (Lagrangian) point of view, or a gridded (Cartesian) approach. To extract patterns from the supercell dataset, unsupervised classification is a powerful toolbox, as it does not impose a priori assumtions. Methods, such as hierarchical clustering, k-means clustering and self organizing maps divide the data in statistically similar subsets without previous biases. To further extend the analysis, we have the opportunity to explore polarimetric radar data within the storms, which holds more information on the internal processes. To be able to extract specific features and include them in the clustering methods, dimensionality reduction techniques are required. Fourier Transforms, Principal Component Analysis (PCA) and Uniform Manifold Approximation and Projection for Dimension Reduction (UMAP) are among the methods available for meaningful dimensionality reduction. These can not only be employed to obtain features from gridded data, but also to summarize a storm lifecycle. This opens the possibility to cluster the supercells from a Cartesian point of view, for each timestep of each storm, or from a Lagrangian point of view, summarizing the lifecycles. The results from Cartesian analysis will likely present the different stages of intensity within a storm’s lifecycle, whereas the lifecycle analysis is more likely to differentiate sub-types of supercells occurring in Switzerland.
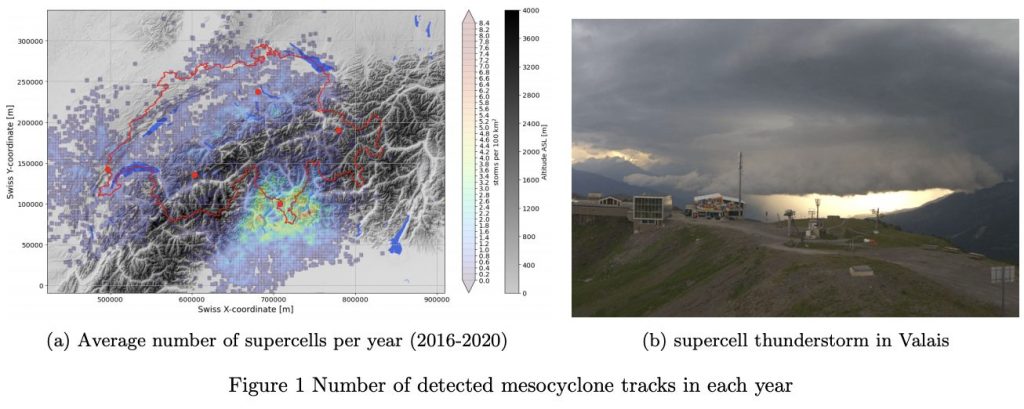
Research goals:
- Data preparation: case selection, data extraction, Cartesian gridding, feature computation / dimensionality reduction
- Clustering: selection of techniques, testing, Lagrangian vs Cartesian approach
- Cluster analysis: splitting factors, life cycle analysis, underlying dynamics
Requirements:
- programming experience, ideally python
- experience in machine learning
- background knowledge in atmospheric physics
Contact : [email protected]
Rivers play important roles in shaping global hydrological and biogeochemical cycles and river discharge quantification in space and time is highly relevant for a large variety of socio-economic activities ranging from irrigation supply, hydropower and thermal energy production, inland navigation to riverine biodiversity. More generally, knowledge of the hydrological states and their variability on our planet is key information for a variety of scientific disciplines, including geology, ecology, and agriculture. Unfortunately, most of the stream reaches in the world are poorly or not monitored at all due to the inaccessibility of most headwaters and a lack of financial and human resources; and access to hydrological data is often hindered by political barrier. Global hydrologic models (GHMs) simulations can be used to predict river discharge in ungauged basins, but recent works demonstrated that GHMs struggle in reproducing several characteristics of the monthly hydrograph, especially for what concern river flow dynamics and climatology (Ghiggi et al., 2019). To overcome GHMs deficiencies, Ghiggi et al., 2019 exploited a large database of global in-situ river discharge measurements to constrain monthly runoff, which is defined as the amount of water draining from a land unit to the river network. The derived global monthly runoff reconstruction GRUN (Ghiggi et al., 2019) spans 120 years and has been shown to outperform the accuracy of GHMs. This Master Thesis Projects aims to create a global reconstruction of monthly river discharge over the period 1900-2019 by routing the runoff estimates of GRUN (Ghiggi et al., 2019) through global hydrography datasets such HYDROSHEDS (Lehner et al., 2008,2013) and MERIT Hydro (Yamazaki et al., 2019)(see Fig. 1).
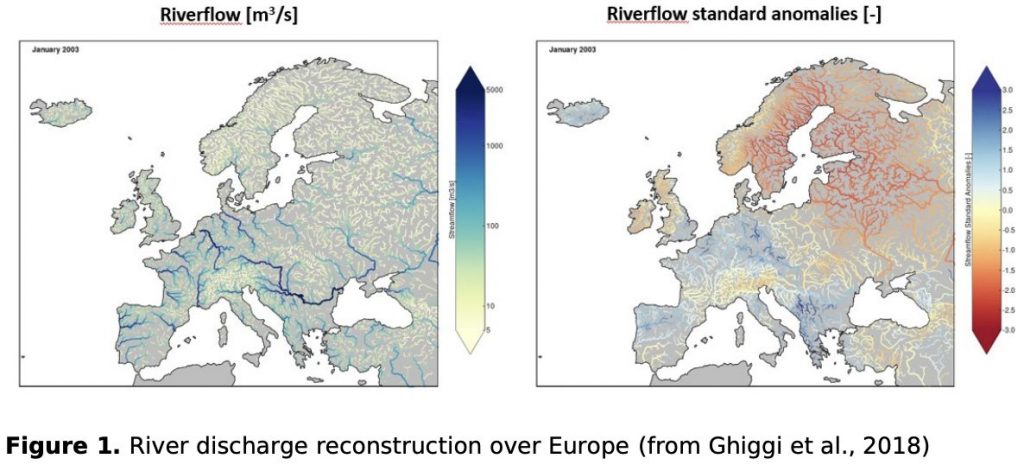
The student is therefore asked to develop an efficient simple routing algorithm (Fig. 1), able to route (cumulate) runoff down to the river basin outlets. The derived gridded/vectorized river discharge reconstruction will then be benchmarked against publicly available existing global datasets such FLO1K (Barbarossa et al., 2018), GRADES (Lin et al., 2019) and GLOFAS (Harrigan et al., 2020). Finally, a climatology analysis of the dataset is expected to complement existing hydro-environmental rivers characteristic datasets such HYDROATLAS (Linke et al., 2019).
Objectives:
- Development of an efficient a river routing algorithm
- Production of a global reconstruction of river discharge
- Benchmark against current river discharge datasets (GRADES, GLOFAS, FLO1K)
- Short climatological analysis of hydrological regimes
Requirements:
- Interest in hydrology and GIS
- Good programming skills in python or R
References:
Alfieri, L., Lorini, V., Hirpa, F. A., Harrigan, S., Zsoter, E., Prudhomme, C. and Salamon, P.: A global streamflow reanalysis for 1980-2018, J. Hydrol., 2019.
Barbarossa, V., Huijbregts, M., Beusen, A. et al.: FLO1K, global maps of mean, maximum and minimum annual streamflow at 1 km resolution from 1960 through 2015. Sci Data 5, 180052, 2018.
Ghiggi, G.: Reconstruction of European monthly runoff and river flow from 1951 to 2015 using machine learning algorithms, Master Thesis, ETHZ, 2018
Ghiggi, G., Humphrey, V., Seneviratne, S. I., and Gudmundsson, L.: GRUN: an observation-based global gridded runoff dataset from 1902 to 2014, Earth Syst. Sci. Data, 11, 1655–1674, https://doi.org/10.5194/essd-11-1655-2019, 2019.
Lehner, B., Verdin, K. & Jarvis, A.: New global hydrography derived from spaceborne elevation data. Eos Trans. AGU 89, 93–94, 2008
Lehner, B. & Grill, G.: Global river hydrography and network routing: baseline data and new approaches to study the world’s large river systems. Hydrol. Process. 27, 2171– 2186, 2013.
Linke, S., Lehner, B., Ouellet Dallaire, C. et al.: Global hydro-environmental sub-basin and river reach characteristics at high spatial resolution. Sci Data 6, 283, https://doi.org/10.1038/s41597-019-0300-6, 2019.
Lin, P., Pan, M., Beck, H. E., Yang, Y., Yamazaki, D., Frasson, R., et al.: Global reconstruction of naturalized river flows at 2.94 million reaches. Water Resources Research, 55, https://doi.org/10.1029/2019WR025287, 2019
Harrigan, S., Zsoter, E., Alfieri, L., Prudhomme, C., Salamon, P., Wetterhall, F., Barnard, C., Cloke, H., and Pappenberger, F.: GloFAS-ERA5 operational global river discharge reanalysis 1979–present, Earth Syst. Sci. Data Discuss., https://doi.org/10.5194/essd2019-232, in review, 2020.
Yamazaki, D., Ikeshima, D., Sosa, J., Bates, P. D., Allen, G. H., & Pavelsky, T.M.: MERIT Hydro: a high‐resolution global hydrography map based on latest topography dataset. Water Resources Research, 55, 5053–5073. https://doi.org/10.1029/2019WR024873, 2019.
Contact: [email protected]
Context :
Coral reefs are suffering a worldwide decline due to the degradation of the marine environment. One of the main causes of this decline are the anomalous heat waves that provoke the death of hard skeleton corals, the cornerstone of the reef ecosystem. As the pace of climate change forecasts stressful conditions to become persistent around the world in the next decades, there is an urgent need in identifying coral populations that are more tolerant to thermal stress. To this end, the seascape genomics approach can be used to investigate adaptation to the environment in coral populations. This approach is at the crossroads between oceanography and populations genomics. To date, the seascape genomics approach relies on publicly available environmental datasets such as those made available by the Copernicus Marine Environment Monitoring System (CMEMS). Data from CMEMS combine remote sensing observations with in-situ records to provide a global scale characterization of ocean conditions (e.g. temperature, salinity, chlorophyll concertation). These products, however, were not conceived to study the biology of marine sessile organisms. One of the main limitations is spatial resolution, which is rarely available at a finer scale than 1 km. This is problematic because a seascape, especially in proximity to the coastline, can display fine-scale Téléphone : +41 21 69 382 83 secr. E-mail : [email protected] EPFL ENAC IIE Devis Tuia, Prof. Rue de l’Industrie 17 Case Postale 440 CH – 1951 Sion ECEO 2 ENAC IIE ECEO structures that can drive adaptive processes in coral populations. Without a higher resolution in the seascape characterization, these adaptive processes cannot be detected with the seascape genomics approach. This master project considers solutions for the issue of mapping corals from above with high resolution remote sensing. In this project, the student will approach the question of high-resolution coral mapping from remote sensing data. Using Landsat 8 and Sentinel 2 satellite images, the presence and density of corals will be characterized with machine learning techniques. Approaches based on feature engineering as random forests and potentially convolutional neural networks (Krizhevsky et al., 2012) will be used for this purpose. The models will be trained on an existing set of coral density reports covering several oceanic regions, which will be matched to remote sensing images (https://www.catlinseaviewsurvey.com/). When trained, the machine learning model will be then deployed on a set of measurements in New Caledonia. When deployed routinely, the developed system could be used to monitor the variation in the seabottom composition and evaluate, for instance, whether specific reefs are gaining or losing coral cover over time. Such information is fundamental, as it might enable to verify whether reefs exposed to recurrent thermal stress are less sensitive to future heat waves
Objectives :
- Gather a remote sensing image collection at the location of records of coral density worldwide
- Develop a machine learning model that predicts the presence of corals and their density from the corresponding satellite image patch
- Provide a map describing changes in coral covers over the last 5 years in the Southern Lagoon of New Caledonia.
Requirements and practical info :
- Krizhevsky, Alex, Ilya Sutskever, and Geoffrey E. Hinton. “Imagenet classification with deep convolutional neural networks.” Advances in neural information processing systems. 2012.
- Antoine Collin, Jean Laporte, Benjamin Koetz, François-Régis Martin-Lauzer, Yves-Louis Desnos.Mapping bathymetry, habitat, and potential bleaching of coral reefs using Sentinel-2. 13th Interna-tional Coral Reef Symposium (ICRS 2016), Jun 2016, Honolulu, United States. pp.405-420. hal-01460593
- Oliver Selmoni, Estelle Rochat, Gael Lecellier, Veronique Berteaux-Lecellier, Stéphane Joost (2020). Seascape genomics as a new tool to empower coral reef conservation strategies: An example on north-western Pacific Acropora digitifera. Evolutionary Applications, 588228. https://doi.org/10.1111/eva.12944
Contact :
Prof. Devis Tuia, [email protected]
Dr. Stephane Joost, [email protected]