ENAC labs offer semester projects to students of all EPFL sections interested in applying their data skills to ENAC’s datasets and contribute to our mission of guaranteeing a sustainable living environment for humanity.
Machine Learning
Summary
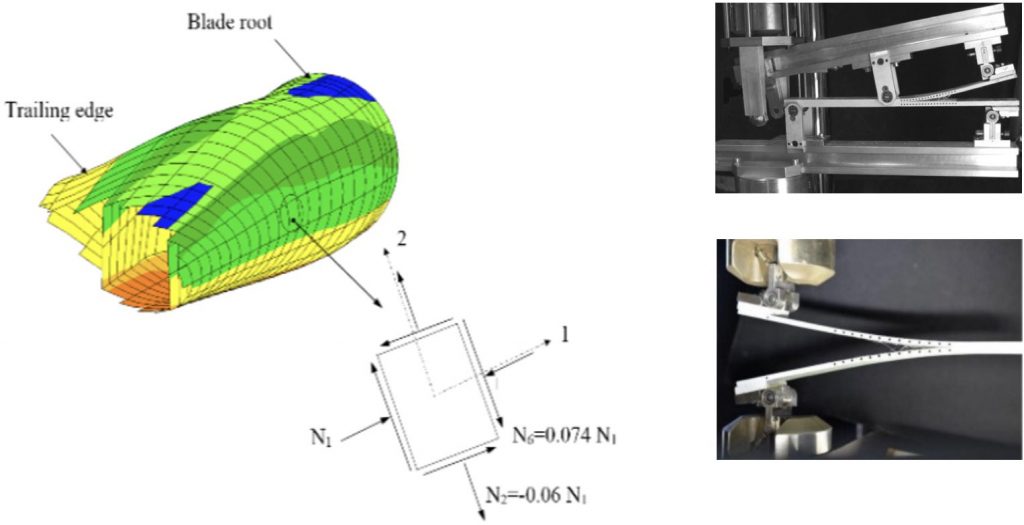
Composite materials in engineering structures face different loading conditions during operation. It is well documented that a major percentage of structural failures happen due to fatigue or fatigue-related phenomena. Most of them are unexpected failures due to defects on the microscale that cannot be identified and do not present any indication, such as a measurable property reduction prior to failure. Modeling of the fatigue/fracture behavior of composite materials is very challenging and has attracted the interest of the scientific and the engineering communities for several reasons. Machine leering techniques can help the development of modeling tools.
Context
Everything that is loaded, even if the loads are low, has a finite life. Fatigue theory is basically empirical/phenomenological; the process of the initiation of microcracks that finally will form macroscopic cracks in the material is not taken into account specifically in the relevant equations. The fatigue properties should therefore be analyzed statistically due to the large variations exhibited during testing. Numerous experimental programs have been conducted over recent decades for the characterization of the fatigue behavior of several structural materials of that particular time. As technology developed and new test frames and measuring devices were invented, it became far easier to conduct complex fatigue experiments and measure the properties and characteristics of materials, of structural components, even of full-scale structures. As a result, almost all failure modes were identified and many theoretical models have been established for modeling and eventually predicting the fatigue life of several different material systems. Significant support has been provided by the new monitoring and damage identification techniques, such as the Digital Image Correlation (DIC) and x-ray tomography. Nevertheless, fatigue theories, even today, are basically empirical. Fatigue model equations dealing with damage and remaining life are, literally, “fitted” to existing experimental data from material/component testing in order to calibrate their parameters and produce reliable simulation of the exhibited behavior and/or prediction of the fatigue life under different loading conditions or material configurations.
Project objectives
This project aims to develop and implement machine learning tools for the simulation of the quasi-static and fatigue/fracture performance and damage development of composite materials and structures.
Data description
The training data consists of derived data from experiments under different loading conditions including fatigue loading at different R-ratios, and different fracture modes. Load/displacement/lifetime data are available for different material systems and joints, as well as a great number of DIC and thermal camera photos collected during the experiments. Previous work shown that this is feasible for fatigue life modeling, see e.g., [1-3], although such methods have not be applied for modeling fracture mechanics data, neither of for the interpretation of DIC and thermal camera photos.
Contacts : [email protected], [email protected]
References
- P. Vassilopoulos, R. Bedi, “Adaptive Neuro-Fuzzy Inference System in modelling fatigue life of multidirectional composite laminates”, Comput Mater Sci, 2008;43(4):1086-1093
- P. Vassilopoulos, E. F. Georgopoulos, T. Keller, “Comparison of genetic programming with conventional methods for fatigue life modelling of FRP composite materials”, Int J Fatigue, 2008;30(9):1634-1645
- A. P. Vassilopoulos, E. F. Georgopoulos, V. Dionyssopoulos, “Artificial neural networks in spectrum fatigue life prediction of composite materials”, Int J Fatigue, 2007;29(1):20-29 (In the TOP25 Hottest Article list of Int J Fatigue for the period Oct-Dec 2006)
Flow cytometry (FC) is a common high-throughput laboratory technique to detect and measure optical properties of cells. In FC, suspended cells are hydrodynamically focused and then pass a laser beam. Typically, individual cells pass the laser beam at a high rate (thousands of cells per second) and multiple optical properties, such a fluorescence and scatter are simultaneously measured. In the SBER lab, we use FC to count bacterial cells in environmental samples. Currently, we are working on samples from glacier-fed streams all around the world. These samples typically contain only relatively few bacterial cells and at the same time show high background noise in FC. This background is typically caused by mineral particles of similar size to bacterial cells.
The aim of this semester project would be to establish a machine learning routine which makes use of the multi-parameter nature of the FC dataset to differentiate between bacterial cells and background noise. The idea is to identify samples in which background noise and cell signal are distinct and to learn from these samples the optical signatures of bacterial cells. Then, the algorithm should apply these criteria to samples in which cell signal and noise overlap.
Contacts: [email protected]
Context
The human interaction with the building is a key cause of uncertainty when predicting energy consumption of buildings with energy simulation tools. Building occupants affect building energy use directly and indirectly by interacting with building energy systems, for example, by adjusting thermostats, switching lights on/off, using electrical devices and opening/closing windows.
To reduce current inconsistencies in building energy simulation, several probabilistic and data-driven modelling approaches have been developed, and integrated into advanced simulation programs to account for uncertainties related to human factors when predicting building energy consumption. These approaches include models for occupancy patterns, occupants’ activities, adjustment of thermostat settings, or usage of plug-in appliances, and sometimes also aim to anticipate the operation of windows and lighting controls or the regulation of window blinds/shades as functions of various environmental (e.g. indoor/outdoor temperature) and contextual drivers (e.g. time of the day). Current predictive methods for data-driven modelling of occupant behaviour in the built environment include for instance:
- Logistic regressions (examples)
- Markov chain models (examples)
- Bayesian networks (examples)
- Machine learning methods (examples)
Data description
The data collection involved a wide range of environmental variables in a Swiss open space office, including the 4 Indoor Environmental Quality categories (thermal, IAQ, visual, and acoustics), tracked behavioural data (e.g. window and window blinds control actions) and occupants’ subjective feedback (personal characteristics, comfort perception and self-reported motivations behind interactions with windows and window blinds) collected through point-in-time and long-term surveys.
The data size collected with the environmental sensors is approximately 20.000 datapoints (2 weeks of measurements in 1-minute timesteps*5 monitoring campaigns) across different seasons. It is a rather unbalanced dataset due to “rare-event” target variables (e.g. window opening).
Project objective
The main objective of the project is to explore different predictive modelling strategies that best capture occupants’ control action (over windows and blinds) using quantitative measurements as explanatory variables. The aim is to highlight key influencing factors behind actions based on the collected quantitative data and verify if the findings match with self-reported motivations by the occupants, also in relation to their perception of environmental comfort.
Semester student project
Pre-requisite: statistics background, data analysis and modeling experience
Contacts: [email protected], [email protected]
Context
Office employees are exposed to a variety of environmental and contextual stimuli that influence their comfort and behavior in the built environment. Despite the advancements in the understanding of separate fields of comfort (thermal, olfactory, visual, and acoustic), the combined effect of Indoor Environmental Quality (IEQ) factors on user perception and behaviour in real buildings merits further explorations. Determining how indoor environmental conditions influence occupants’ perception of comfort and consequently their desire to change their conditions through interactions with the building envelope might be even more challenging in open space offices, since the same space might be occupied by a large variety of humans with different individual preferences over the indoor environment and needs for having an acceptable and productive work environment. Further, current comfort standards or models may not always meet actual user preferences, and comfort/preference votes of occupants should be carefully and jointly evaluated with environmental measurements in the space to gain deeper insights into the discrepancies of comfort perceptions among individuals and between individuals and standardized comfort parameters.
Data description
The dataset includes environmental measurements in a Swiss open space office and subjective responses from the building occupants. In particular, the multi-domain data collection strategy included the monitoring of four environmental dimensions: thermal, olfactory, visual, and acoustic. The objective data collection was performed simultaneously with point-in-time surveys of occupants’ perceptions of comfort/preference votes and motivations behind their actions, as well as long-term surveys on (i) employees’ background information (e.g., personal characteristics, work routines, etc.) and (ii) employee’s personal perception that might be sensitive to seasonal variations (e.g., personal comfort preferences, perceptions, satisfactions, preferred adaptive opportunities etc.).
The data size collected with the environmental sensors (quantitative data) is approximately 20.000 datapoints (2 weeks of measurements in 1-minute timesteps*5 monitoring campaigns across different seasons).
The data size of point-in-time survey answers (qualitative data) is approximately 500 datapoints (100 datapoints*5 campaigns across different seasons).
Project objective
The objective of this project is to find correlations between the quantitative (physical measurements of the environment) and qualitative (subjective feedback from the employees concerning their environmental comfort) data. Environmental data and subjective feedback from the occupants should for instance be evaluated jointly to gain insights into the relationship between comfort/preference votes over the indoor environment and actual environmental conditions in the space at the time of the response, also in relation to actions performed by the occupants. The data can further be analyzed according to different seasons/buildings and the respondent’s location in the space (e.g., close to window vs central vs corridor).
Semester student project
Pre-requisite: solid statistics background
Contacts: [email protected], [email protected]
Summary
The prediction of long-term wind speed is essential for the development of wind energy. Meteorological reanalysis datasets provide with estimates of the main atmospheric and climate variables. They are the result of the assimilation of a combination of data sources including measurement, observation and simulation data to describe weather occurrences in the closest way to reality. Reanalysis are only available for historical time periods and usually up to present. While wind speed data from reanalysis sources are widely used in wind resource assessment, they do not inform on the future state of the local climate. Climate models are the main source of knowledge on the future state of climate variables, including wind speed. Yet their uncertainty and low spatial resolution render their use difficult for wind assessment. The purpose of this project is to use machine learning methods to generate wind speed data projections based on historical data from reanalysis datasets and provide with higher resolution data than the current climate models in India.
Context
Since the world is moving towards green energy, wind energy will play a vital role in the future energy system. Long-term wind speed forecasting is critical for energy development and management, and wind farm optimal design. The historical trends and future projections of the wind resource provide a scientific basis for long-term planning. Currently many wind speed prediction methods exist and include physical methods, statistical methods, and artificial intelligence methods. Neural network forecasting methods are widely used in various areas including sustainable urban development and financial forecasting. Recently, there has been growing interest in the possibility of using neural networks for both weather and climate forecasting. The possibility to further explore neural networks application to improve long-term wind speed prediction in regions threatened by climate change could offer further incentive for wind energy developers. Such predictions would offer an alternative to current regional climate models that can be used as a baseline for the comparison.
Data description
The data available for this project are the following:
- Climate variables from ERA5 which is the most recent reanalysis dataset produced by the European Centre for Medium-Range Weather Forecasts (ECMWF; http://www.ecmwf.int/en/forecasts/datasets/reanalysis-datasets/era5). ERA5 provides with a global coverable on a 30 km grid, and hourly estimate of a large number of climate variables. The ERA5 includes wind speed measurements at 10 m and 100 m height from 1979 to present, along with other variables made available for this project.
- Wind speed projections from Regional Climate Models in the regions: 10 m wind speed at 25 km for wind speed at 10 m with time resolution of 3h (also daily, and monthly).
Project objectives
The purpose of the study is to use the ERA5 of the last 40 years (1979-2019) for long-term forecasts of wind speed at 10 m height in India.
Contact: [email protected]
Machine learning (Computer vision)
Context
Waterborne viruses are widespread in wastewater and in the environment. In water unit treatments, they are mainly controlled by physical-chemical methods. In our study we investigate the potential of using biological methods as a complementary technique. Specifically, we demonstrated that protists can remove infectious viruses from water, suggesting promising potential applications for water and wastewater treatment purposes. To understand better the underlying mechanisms of such a process, we analyzed the content of the protists food vacuoles. We detected human adenovirus type 2 (HAdV2) particles as small as 90 nm.
Issue and objective
In order to get a robust analysis, a large number of images has to be scanned to detect and count such viral particles. This is time-consuming and the detection efficiency can vary among operators. For those reasons, we aim at performing an automated treatment of the images.
Perspectives
- The model we used here consists of the T. pyriformis protists and HAdV2. Yet, the model could also be adapted and serve to detect other human viruses included in our study, such as a SARS-CoV 2 surrogate or rotavirus.
- Joint publication of the model and its application in environmental virology research.
Current state of the project and future steps
The first phasis of the project has succesfully been completed by a team of IC students who built the labeling pipeline, a pre-processing pipeline including data augmentation steps, and a training pipeline based on Tensorflow, training a UNet architecture, transfer learning from the mobilenet. This simple approach gives baseline results, but performance could be greatly improved, in particular on lower zoom images. More images will be provided (we aimed to a total of at least 400 images, including negative control images).
This project aims to build on this baseline pipeline, potentially exploring other modeling approaches, as well as improving the pre-processing steps (in particular re-sizing images to comparable zoom levels) to improve performance.
Objectives :
Main objectives:
- Segementation of viral particles on low magnitude images (i.e. images showing one food vacuole).
Secondary objectives:
- Quantification of viral particles number per food vacuole surface area
- Classification of viral particles based on their digestion state
Contact: [email protected], [email protected]
Summary
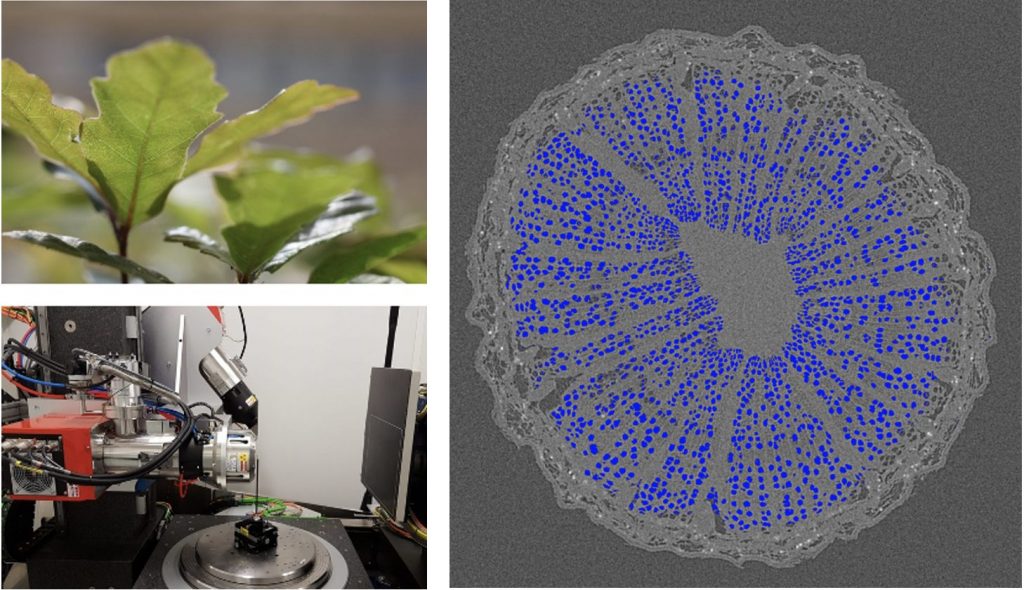
Water transport in plants is crucial to their productivity and survival; better understanding water’s internal dynamics in plants and trees provides insights in their reaction to climate changes. X-ray micro-tomography images allow to view water bubbles in plant compartments, in order to quantify water transport. An automated pipeline to segment the water bubbles from these images would greatly speed the workflow: This projects aims to develop and implement an image segmentation algorithm to delineate the water bubbles in the tree trunks images obtained from X-ray micro-tomography.
The training data consists of hundreds of labeled images, each containing up to hundreds of water bubbles. A preliminary project already set up a pre-processing pipeline, cropping images to the same resolution, as well as optional data augmentation. A simple implantation of UNet on Pytorch has also already been tested, and provides a baseline. The aim of this project is to build on this pipeline, tune this model or explore other image segmentation algorithms and compare performance. The models will be evaluated on both precision and recall. The final model should be deployed to be easily re-used by the community.
Contact: [email protected], [email protected]
Data architecture
Objective:
Streamline data acquisition and pre-processing of Swiss climate data for ENAC labs.
Prototype a portal to access a queryable database of meteorological data, streaming data real-time from MeteoSwiss and potentially other sources. In collaboration with IC students who will handle the data architecture, the SIE student assess the needs of researchers, design the appropriate functionalities of the platform, and implement an example use case.
Main tasks of this collaborative student project:
- Data architecture part (IC student – 12 credits)
- Phase 1 : Background and needs analysis — Literature review comparing existing data repositories and ways of accessing these datasets (Geovite, IDAWEB, ENACFiles…)
- Phase 2 : Design — Responsible for technology choices, assess potential integration with existing data repositories, and other open source tools such as Renku.
- Phase 3: Fast prototyping — Implement a prototype
- SIE GIS part (SIE student – 4 credits)
- Phase 1 : Background and needs analysis — From a survey of ENAC labs using MeteoSwiss data, compile a list of the exact datasets used.
- Phase 2 : Design — From discussion with researchers, list the important functionalities of the platform (e.g download, visualise, filter…)
- Phase 4: Feedback and iteration
Contacts : [email protected], [email protected]
Earth Observations
At the Stream Biofilm and Ecosystem Research Laboratory (SBER), we study microbes that live in glacier-fed streams all around the world. We aim to answer questions relating to the loss of these unique habitats as the glaciers are melting because of climate change. An expedition team travels to these remote sites and samples stream biofilms for microbiological and molecular analyses in the lab. Several parameters related to the glacier (e.g. surface area, glacierization of the catchment, distance between the glacier terminus and sampling site, etc.) are important descriptors of the environmental conditions in the glacier-fed streams. We employ remote sensing to obtain these parameters for 200 glacier systems around the world. Students will develop an automated routine that would select the most recent cloud-free and snow-free imagery available, for a region of interest. Currently the imagery used is Sentinel 2, level-2A products. The choice of tool is left to the discretion of the students (Sentinel-2 Toolbox, Google Earth Engine, or any tools of choice)
Contacts : [email protected], [email protected]
Coral reefs are estimated to cover 1% of the sea floor, nevertheless they host one third of the marine wildlife. This is due to the fact that many marine species, across a wide range of taxonomical categories, depend on this habitat for spawning, breeding, feeding, hunting or nursing. It is therefore not surprising that coral reef health shapes the structure and abundance of fish communities and can induce significant bottom-up changes on the planet food chains and biogeochemical cycles. This has a direct impact on the local fishing activities, which is noteworthy since coral reefs are present in more than 100 countries and provide protein supply to tens of millions of people. Besides, coral reefs represent a crucial physical barrier to mitigate the impact of currents, waves and storms on the coastlines, with an economical value estimated up to several millions of dollars.
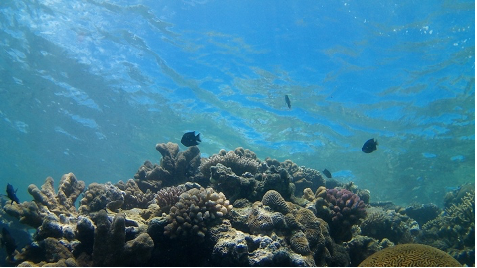
Over the last decades, the degradation of water conditions had caused a severe decline in coral reefs around the world. An important part of this decline is due to global stressors associated with climate change, such as the raise in water temperature and ocean acidification. In particular, the anomalous raise in water temperature causes coral bleaching, a phenomenon that is decimating coral population around the world. Coral reef degradation is also caused by stressors related to local activities. Such stressors can be the wastes of human activities (e.g. industrial, agricultural, urban) or the run-off of sediments produced by coast construction. Human pressure on the reef ecosystem can also be driven by boat traffic from fishing or touristic activities, or from sea transportation.
Remote sensing data offers unprecedented opportunities to characterize the stressors that are causing the decline of coral reefs. For instance, spatial patterns of water temperature variation can be estimated using remote sensing at 1 km resolution for any reef around the world. Furthermore, remote sensing makes it possible to evaluate the land use in coastal areas, and therefore to identify polluting activities and measure their distance from coral reefs.
In this project, the student will learn how to process remote sensing data to characterize the environmental stressors causing coral reefs decline. The focus will be brought on different coral reef regions around the world, where information on the state of the reef is publicly available (https://www.catlinseaviewsurvey.com/). The student will then produce a characterization of the environmental conditions in the different areas. Such characterization will encompass: (1) existing descriptors of water conditions derived from publicly available remote sensing products (e.g. water temperature at 1 km of resolution; (2) new descriptors of water conditions derived from raw remote sensing data; (3) new descriptors of local stressors derived from the remote sensing of land use. The student will investigate the environmental descriptors correlated with changes in the state of coral reef. The most pertinent descriptors will then be used to characterize local stressors of coral reefs the Red Sea, where a transnational project is setting-up at EPFL to study the state of corals of the region.
Contacts
Charlotte Weil, ENAC-IT, [email protected]
Oliver Selmoni, LASIG, [email protected]
Stephane Joost, LASIG, [email protected]
Literature
- Selmoni, O., Lecellier, G., Vigliola, L., Berteaux-Lecellier, V. & Joost, S. Coral cover surveys corroborate predictions on reef adaptive potential to thermal stress. Sci. Rep. 10, 1–13 (2020).
- Maina, J., Venus, V., McClanahan, T. R. & Ateweberhan, M. Modelling susceptibility of coral reefs to environmental stress using remote sensing data and GIS models. Ecol. Modell. 212, 180–199 (2008).
- De’ath, G., Fabricius, K. E., Sweatman, H. & Puotinen, M. The 27-year decline of coral cover on the Great Barrier Reef and its causes. Proc. Natl. Acad. Sci. U. S. A. 109, 17995–9 (2012).
- Cinner, J. E. et al. Bright spots among the world’s coral reefs. Nature 535, 416–419 (2016).
- Ateweberhan, M. et al. Climate change impacts on coral reefs: Synergies with local effects, possibilities for acclimation, and management implications. Mar. Pollut. Bull. 74, 526–539 (2013).
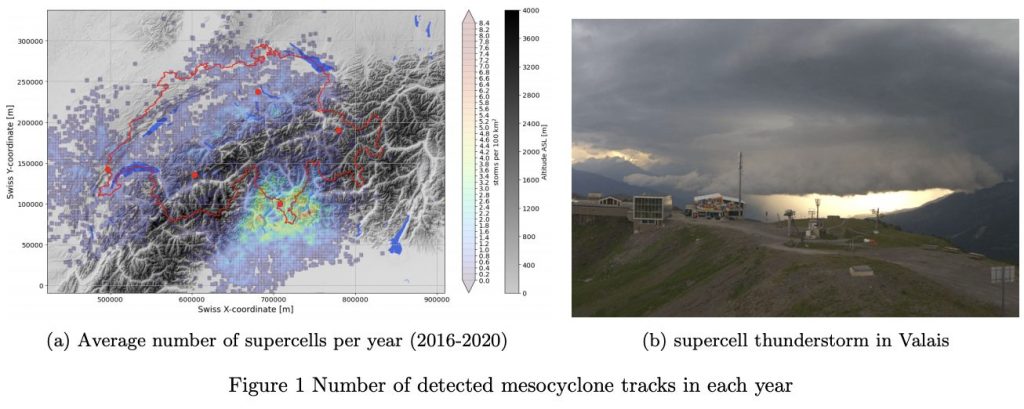
Supercell thunderstorms are among the most dangerous severe weather phenomena. With a recently established multi-year dataset of supercell occurrences in Switzerland, we aim to improve our understanding by utilizing unsupervised machine learning. The dataset provides metrics on the strength and size of the observed supercell and can be extended with information on terrain, location and synoptic weather situation. To interpret the data and extract patterns in the occurrence of supercells, we aim to employ unsupervised learning techniques. These can be approached from a lifecycle (Lagrangian) point of view, or a gridded (Cartesian) approach. To extract patterns from the supercell dataset, unsupervised classification is a powerful toolbox, as it does not impose a priori assumtions. Methods, such as hierarchical clustering, k-means clustering and self organizing maps divide the data in statistically similar subsets without previous biases. To further extend the analysis, we have the opportunity to explore polarimetric radar data within the storms, which holds more information on the internal processes. To be able to extract specific features and include them in the clustering methods, dimensionality reduction techniques are required. Fourier Transforms, Principal Component Analysis (PCA) and Uniform Manifold Approximation and Projection for Dimension Reduction (UMAP) are among the methods available for meaningful dimensionality reduction. These can not only be employed to obtain features from gridded data, but also to summarize a storm lifecycle. This opens the possibility to cluster the supercells from a Cartesian point of view, for each timestep of each storm, or from a Lagrangian point of view, summarizing the lifecycles. The results from Cartesian analysis will likely present the different stages of intensity within a storm’s lifecycle, whereas the lifecycle analysis is more likely to differentiate sub-types of supercells occurring in Switzerland.
Research goals:
- Data preparation: case selection, data extraction, Cartesian gridding, feature computation / dimensionality reduction
- Clustering: selection of techniques, testing, Lagrangian vs Cartesian approach
- Cluster analysis: splitting factors, life cycle analysis, underlying dynamics
Requirements:
- programming experience, ideally python
- experience in machine learning
- background knowledge in atmospheric physics
Contact : [email protected]
Rivers play important roles in shaping global hydrological and biogeochemical cycles and river discharge quantification in space and time is highly relevant for a large variety of socio-economic activities ranging from irrigation supply, hydropower and thermal energy production, inland navigation to riverine biodiversity. More generally, knowledge of the hydrological states and their variability on our planet is key information for a variety of scientific disciplines, including geology, ecology, and agriculture. Unfortunately, most of the stream reaches in the world are poorly or not monitored at all due to the inaccessibility of most headwaters and a lack of financial and human resources; and access to hydrological data is often hindered by political barrier. Global hydrologic models (GHMs) simulations can be used to predict river discharge in ungauged basins, but recent works demonstrated that GHMs struggle in reproducing several characteristics of the monthly hydrograph, especially for what concern river flow dynamics and climatology (Ghiggi et al., 2019). To overcome GHMs deficiencies, Ghiggi et al., 2019 exploited a large database of global in-situ river discharge measurements to constrain monthly runoff, which is defined as the amount of water draining from a land unit to the river network. The derived global monthly runoff reconstruction GRUN (Ghiggi et al., 2019) spans 120 years and has been shown to outperform the accuracy of GHMs. This Master Thesis Projects aims to create a global reconstruction of monthly river discharge over the period 1900-2019 by routing the runoff estimates of GRUN (Ghiggi et al., 2019) through global hydrography datasets such HYDROSHEDS (Lehner et al., 2008,2013) and MERIT Hydro (Yamazaki et al., 2019)(see Fig. 1).
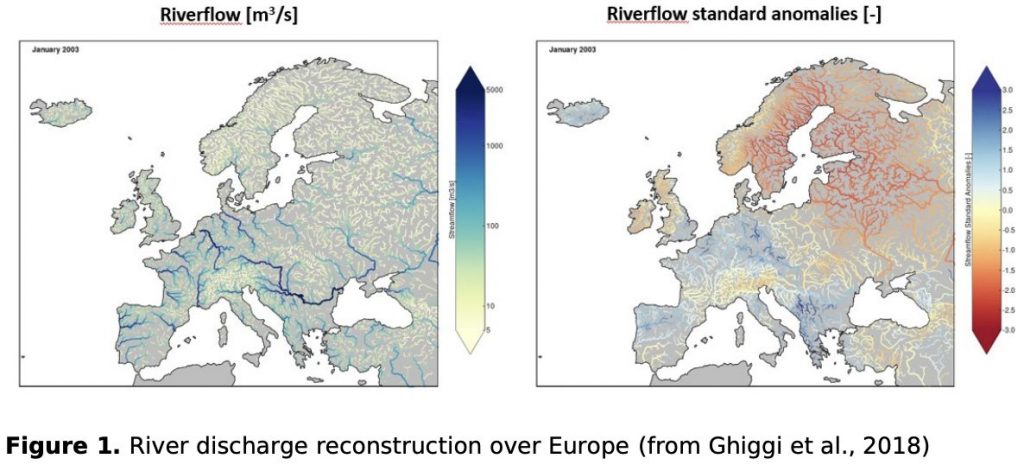
The student is therefore asked to develop an efficient simple routing algorithm (Fig. 1), able to route (cumulate) runoff down to the river basin outlets. The derived gridded/vectorized river discharge reconstruction will then be benchmarked against publicly available existing global datasets such FLO1K (Barbarossa et al., 2018), GRADES (Lin et al., 2019) and GLOFAS (Harrigan et al., 2020). Finally, a climatology analysis of the dataset is expected to complement existing hydro-environmental rivers characteristic datasets such HYDROATLAS (Linke et al., 2019).
Objectives:
- Development of an efficient a river routing algorithm
- Production of a global reconstruction of river discharge
- Benchmark against current river discharge datasets (GRADES, GLOFAS, FLO1K)
- Short climatological analysis of hydrological regimes
Requirements:
- Interest in hydrology and GIS
- Good programming skills in python or R
References:
Alfieri, L., Lorini, V., Hirpa, F. A., Harrigan, S., Zsoter, E., Prudhomme, C. and Salamon, P.: A global streamflow reanalysis for 1980-2018, J. Hydrol., 2019.
Barbarossa, V., Huijbregts, M., Beusen, A. et al.: FLO1K, global maps of mean, maximum and minimum annual streamflow at 1 km resolution from 1960 through 2015. Sci Data 5, 180052, 2018.
Ghiggi, G.: Reconstruction of European monthly runoff and river flow from 1951 to 2015 using machine learning algorithms, Master Thesis, ETHZ, 2018
Ghiggi, G., Humphrey, V., Seneviratne, S. I., and Gudmundsson, L.: GRUN: an observation-based global gridded runoff dataset from 1902 to 2014, Earth Syst. Sci. Data, 11, 1655–1674, https://doi.org/10.5194/essd-11-1655-2019, 2019.
Lehner, B., Verdin, K. & Jarvis, A.: New global hydrography derived from spaceborne elevation data. Eos Trans. AGU 89, 93–94, 2008
Lehner, B. & Grill, G.: Global river hydrography and network routing: baseline data and new approaches to study the world’s large river systems. Hydrol. Process. 27, 2171– 2186, 2013.
Linke, S., Lehner, B., Ouellet Dallaire, C. et al.: Global hydro-environmental sub-basin and river reach characteristics at high spatial resolution. Sci Data 6, 283, https://doi.org/10.1038/s41597-019-0300-6, 2019.
Lin, P., Pan, M., Beck, H. E., Yang, Y., Yamazaki, D., Frasson, R., et al.: Global reconstruction of naturalized river flows at 2.94 million reaches. Water Resources Research, 55, https://doi.org/10.1029/2019WR025287, 2019
Harrigan, S., Zsoter, E., Alfieri, L., Prudhomme, C., Salamon, P., Wetterhall, F., Barnard, C., Cloke, H., and Pappenberger, F.: GloFAS-ERA5 operational global river discharge reanalysis 1979–present, Earth Syst. Sci. Data Discuss., https://doi.org/10.5194/essd2019-232, in review, 2020.
Yamazaki, D., Ikeshima, D., Sosa, J., Bates, P. D., Allen, G. H., & Pavelsky, T.M.: MERIT Hydro: a high‐resolution global hydrography map based on latest topography dataset. Water Resources Research, 55, 5053–5073. https://doi.org/10.1029/2019WR024873, 2019.
Contact: [email protected]