The Toward a Human Centric and Carbon Neutral EPFL Campus project consists of several studies conducted on the EPFL campus (monitoring, simulations and tool development) in order to propose concrete bioclimatic strategies to face climate change.
In one part of the project, infrared pictures were taken and data collected during a monitoring campaign in summer 2018, focusing on the cooling potential of a water wall located in the BC building and its impact on urban microclimatic conditions, outdoor thermal comfort and the energy behaviour.
With respect to the current modification of the Cosandey Square, four CitySim models were designed to evaluate the impact of a future vegetated space for a typical meteorological year (TMY) and for 2100. The objective was to determine the impact of trees on the outdoor thermal comfort of pedestrians, and on the energy demand of neighbouring buildings.
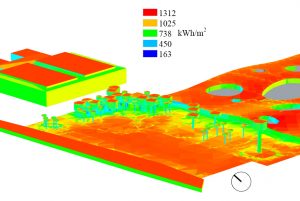
Cumulative annual solar radiation on the Cosandey square
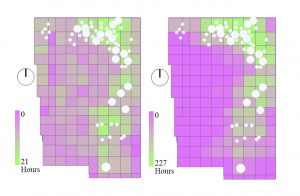
Difference in thermal perception between old and new design of the Cosandey square, during spring and summer
Finally, a Virtual Campus platform was developed to showcase the results from numerous simulations and measurements. All the buildings of the EPFL campus as well as the ground coverage based on Open Street Map, are included into the 3D model. Multiple simulation outputs files (e.g. CO2 emissions, energy demand for the typical meteorological year, for 2050 and with a renovation scenario) are also available. The simulated microclimatic data from the Canopy Interface Model are included, quantifying the impact of different types of ground covering (e.g. grass, asphalt, etc.) and greening design (forest) on the air temperature, wind speed and relative humidity.
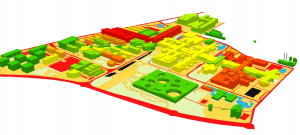
Virtual campus, energy demand and thermal comfort, visualized through the GIS model
The data obtained in these studies can be found at https://doi.org/10.5281/zenodo.2556930.