At EPFL, cutting our carbon emissions is a priority. By measuring our carbon footprint, we can calculate the environmental impact of our operations and identify areas where we need to take action in order to meet the objectives of the Paris Agreement.
In July 2019, the Swiss government set a series of targets aimed at reducing greenhouse gas emissions (in French) in order to underscore its status as a role model. They established two main objectives for federal entities, including EPFL:
- Reduce energy-related greenhouse gas emissions by 50% (from 2006 levels) by 2030
- Achieve carbon neutrality by offsetting energy-related emissions (starting in 2020)
At EPFL, we’re committed to working towards the Swiss government’s climate targets and helping meet the objectives of the Paris Agreement.
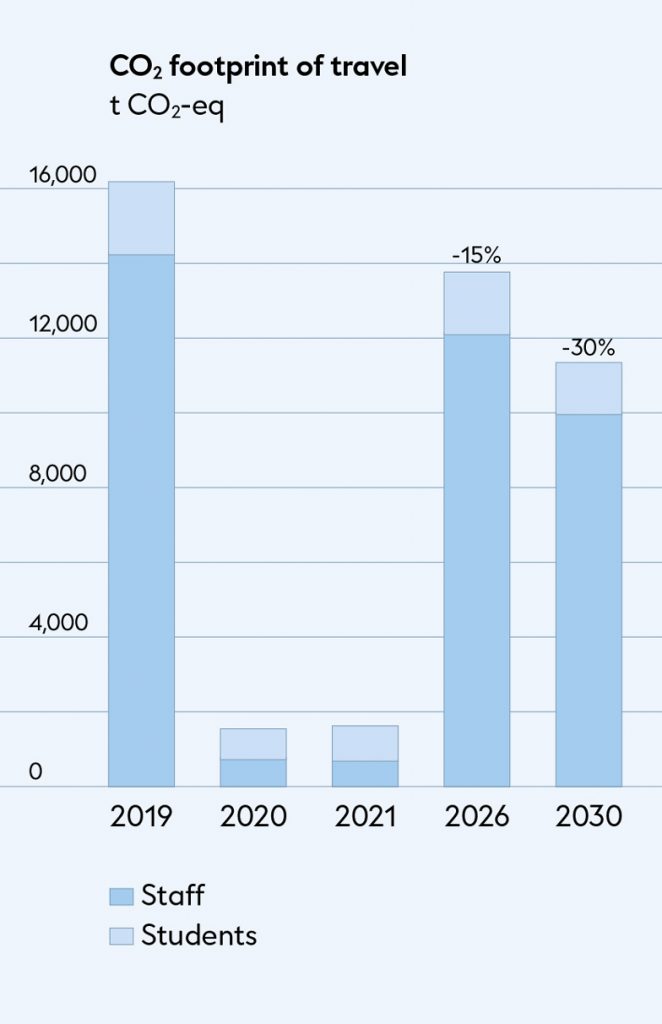
Another target set by the Swiss government is to reduce the carbon footprint of air travel (in French). In order to meet this objective, we set ourselves the goal of cutting our travel-related emissions by at least 30% (from 2019 levels) by 2030.
The figure below shows our carbon footprint from 2006 to 2023.
Our carbon footprint includes energy-, travel-, commuting-, food- and IT-related emissions. It’s calculated using data from our Lausanne campus and our satellite campuses in Valais, Neuchâtel and Fribourg. Data from our Geneva campus are not available.
Click on the graph below to get to its interactive version
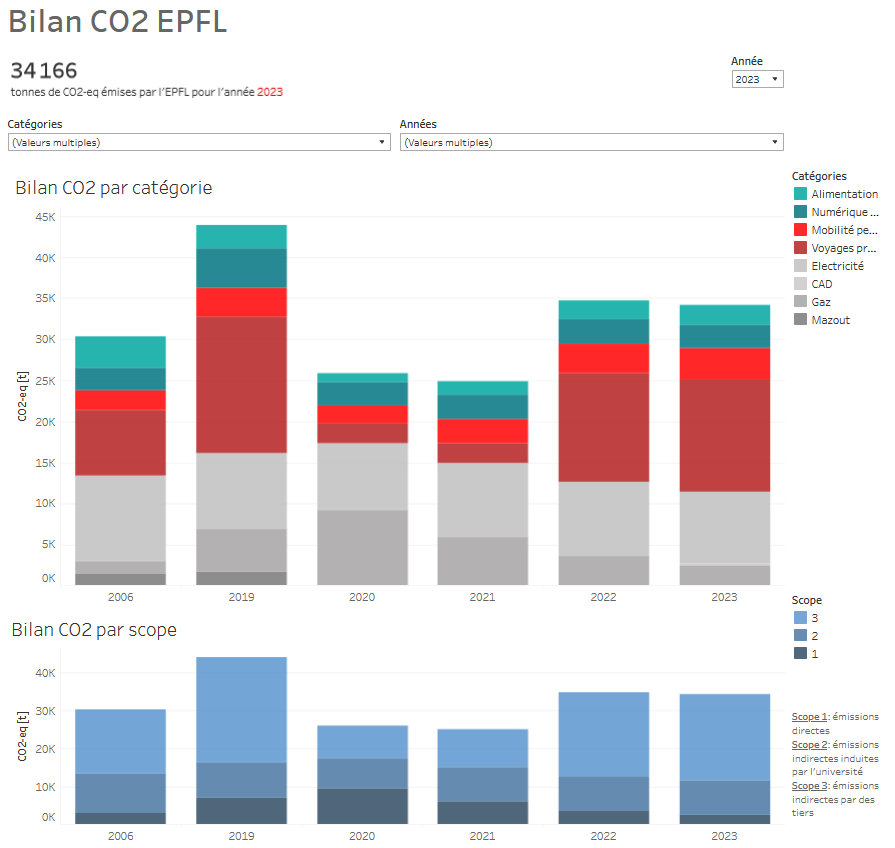
We measure our carbon footprint using the Greenhouse Gas Protocol guidelines. We began monitoring our energy-, travel- and commuting-related emissions in 2010, and added our food- and IT-related emissions in 2018 and 2019, respectively. We’re also in the process of evaluating the carbon footprints of our campus buildings and purchasing processes (for laboratory equipment and supplies, office furniture, etc.), so that we cover all three scopes in the Protocol. An initial estimate based on the cash flows associated with these purchases indicates that these emissions could double our School’s carbon footprint. Travel- and commuting-related emissions account for around two thirds of our carbon footprint, making these areas our main source of emissions.
Carbon accounting is a complicated task with frequently changing methods and scopes. We use various methods to calculate our emissions in each area, depending on the sources of data and their complexity. For energy-, travel-, commuting-, food- and IT-related emissions, we use a CO2-eq conversion factor. We have selected the most appropriate conversion factors from a range of suppliers (ecoinvent, KBOB, World Food LCA database, agribalyse, and others) for each focus area.
We decided to set 2019 as the baseline year since the pandemic artificially lowered our emissions in 2020–2022. From 2011 to 2020, Quantis measured our greenhouse gas emissions until dss+ took over this responsibility in 2021.
In 2018, the Federal Office for the Environment (FOEN) calculated that Switzerland had a carbon emission factor for its power use of 30g CO2-eq/kWh (based on power generation). However, if imported and exported power is taken into account, this figure increases to 128 g CO2-eq/kWh (based on power consumption) (OFEV2021). The second figure is likely a more accurate measure since it includes imported power, which can be considerable in winter, especially from countries using coal-fired power plants.
We prefer the second approach for calculating the real impact of our own power use. We use a conversion factor of 125 g CO2-eq/kWh (KBOB 2022), which takes into account power imported into Switzerland.
In addition to carbon neutrality through offsetting, we also aim to achieve net zero emissions by 2040.
Achieving net zero emissions means removing from the air the same amount of carbon that is released by our operations. This can be done with carbon sinks (such as forests) and negative emissions technology (like carbon removal systems). We have a number of initiatives in place to develop technology for capturing, using and storing carbon; these include the Solutions4Sustainability initiative and many research projects at our labs. Our School intends to serve as a living lab for testing the most promising technology.
In reaching net zero, we will work with other ETH Domain organizations through the Swiss Center of Excellence on Net-Zero Emissions (SCENE), and we are in talks to set up a Net Zero Carbon Fund. But we know that developing new technology will not be enough to get us to net zero, and therefore our top priority remains cutting our carbon emissions.
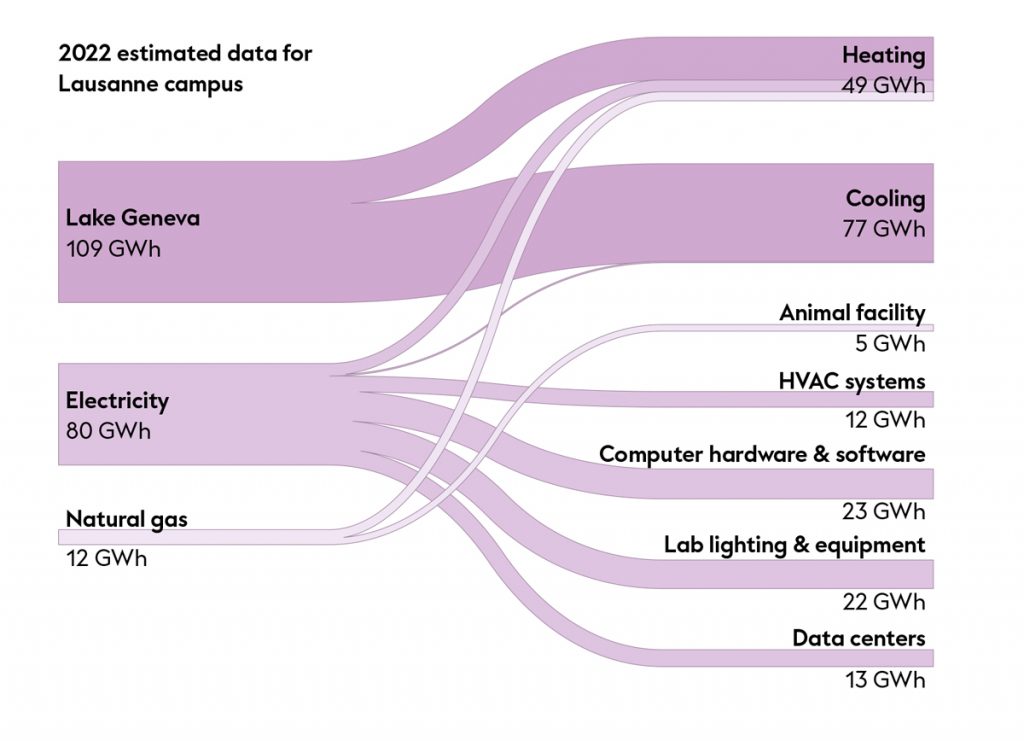
The Swiss government’s target is to reduce energy-related emissions by 50% from 2006 levels. However, in 2006, our Lausanne campus was already largely powered by renewable energy thanks to our thermal power plant which, since 1986, has been drawing energy from Lake Geneva. The fact that we already have a major source of renewable energy on our main campus will make it harder for us to meet the Swiss government’s target.
Nevertheless, we are committed to reducing our power use, renovating and optimizing our buildings, becoming independent of fossil fuels, and expanding our on-site production of renewable energy (such as with our solar park). We may need to purchase offsets for our remaining energy-related emissions in order to reach the government’s target.
The figure above shows an estimate of the heat extracted from the lake water: 109 GWh. This energy is used to cool or heat the campus facilities.
Click on the graph below to get to its interactive version
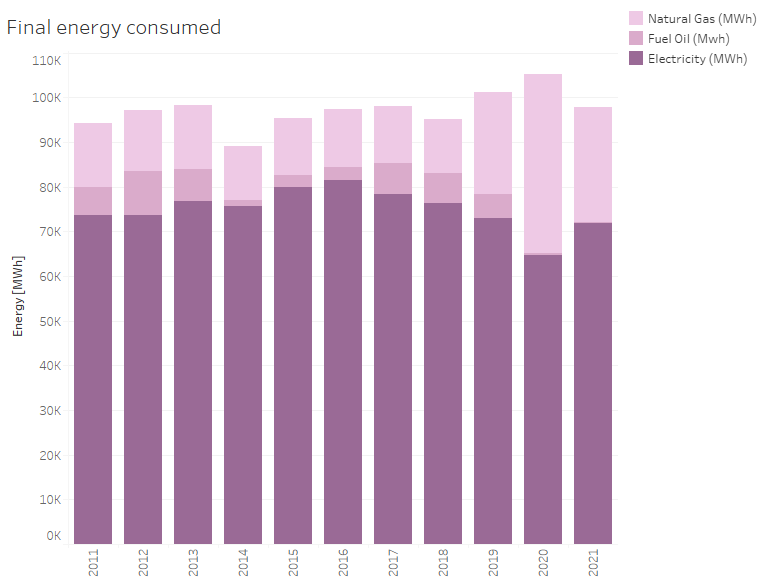
Until 2019, we used gas mainly for heating purposes (60%) and for our research activities (40%). We used significantly more gas for heating while we were upgrading our thermal power plant from 2019–2021. Following these renovations, the plant now operates entirely from electrical power, meaning we no longer use gas to heat the buildings on our Lausanne campus.
We still use gas for some of our research activities (animal facilities) and to heat buildings that we rent to the University of Lausanne. The University of Lausanne plans to install its own thermal power plant that will also run on lake water starting in 2025, which will eliminate its need for heating gas.
Until 2018, in addition to our two heat pumps, we also had two gas turbines that were used during particularly cold periods. These relied on fuel oil. But as of 2020, thanks to the renovation of the thermal power plant, our Lausanne campus is now entirely oil-free.
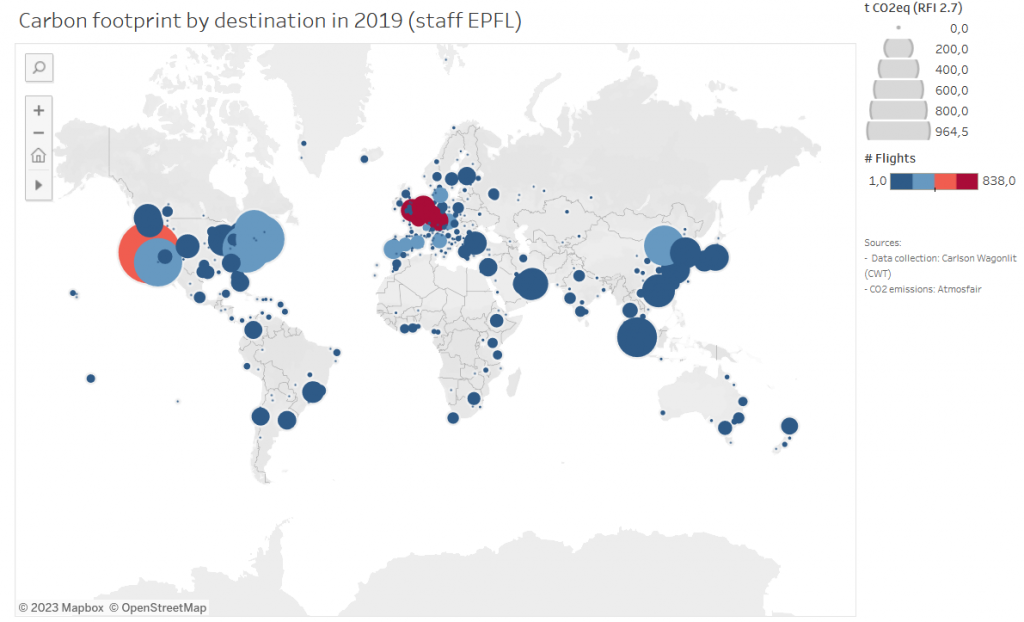
Emissions generated by business and student travel are calculated by Atmosfair with factors given by Verband Deutsches Reisemanagement (VDR) using a radiative forcing index (RFI) of 2.7, based on data provided by CWT, our central travel agency.
Travel and commuting are our main sources of carbon emissions, and we’re therefore introducing measures to reduce these emissions. We have implemented new travel guidelines for business and student trips, are updating our videoconferencing tools, and are planning various awareness campaigns to promote the use of trains whenever possible and to encourage our community members to change their flying habits.
Destinations
Click on the graph below to get to its interactive version
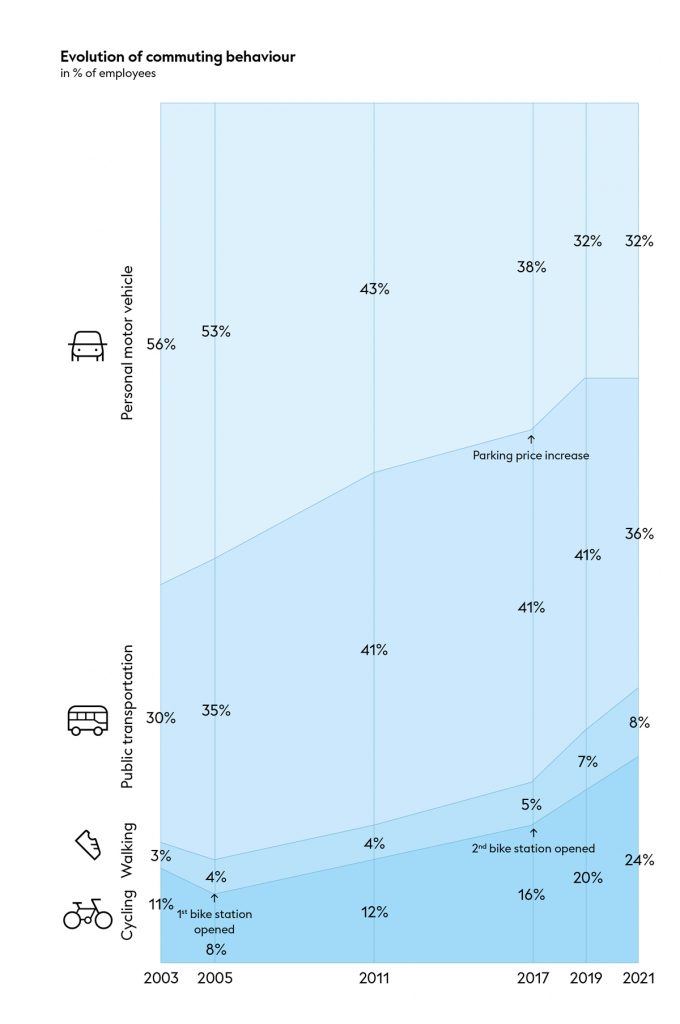
All the data we have on EPFL commuting habits are from the biennial transportation survey that we’ve been carrying out since 2003. We have implemented a series of measures to reduce our commuting-related emissions, such as introducing a new parking policy, subsidizing the purchase of public transport passes and making our outdoor spaces more pedestrian- and bike-friendly. We’re already seeing the positive effects of these initiatives, and especially a sharp decrease in the modal share of personal motor vehicles.
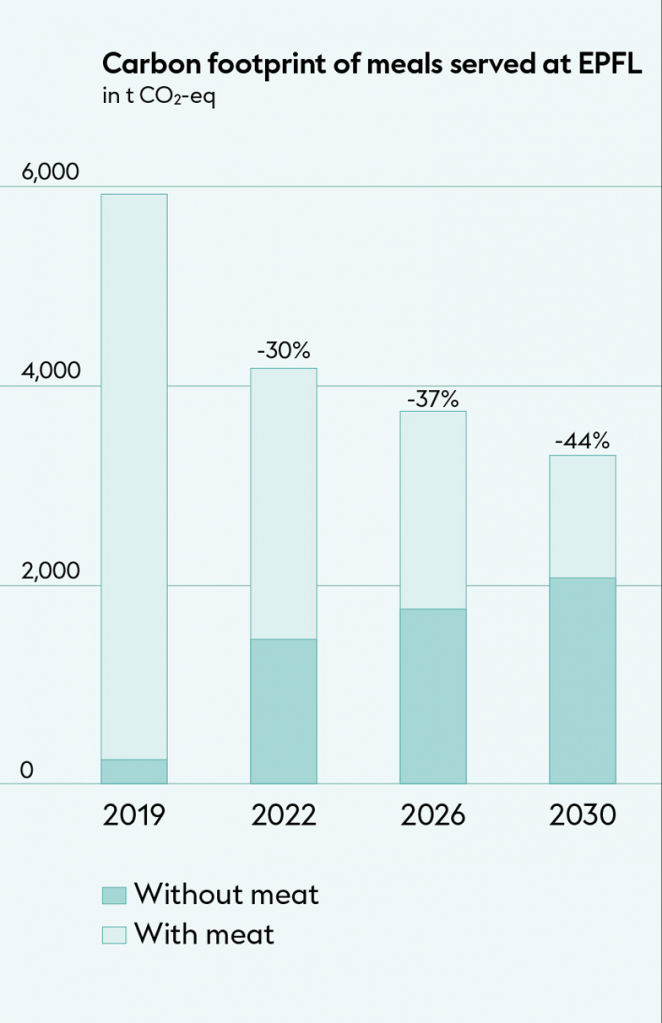
We issued our first food-related emissions report in 2018, which was based on the number of vegetarian and non-vegetarian meals consumed on campus. As of 2019, our reporting process is more detailed and incorporates purchasing data from our restaurant caterers. It is calculated by the Beelong company.
The values used for calculating carbon emissions are from the World Food LCA Database (Quantis) v 3.5, Ecoinvent v 3.8, and Agribalyse v 3.0. The factors used to calculate our food-related carbon emissions are:
- The agricultural output associated with each ingredient
- Produce seasonality (e.g., whether produce was grown in heated greenhouses)
- The shipping of each ingredient to where the finished product is produced (including distance traveled, modes of transportation and refrigeration method)
- The shipping of the finished product to where it is consumed (including distance traveled, modes of transportation and refrigeration method)
- The packaging of the finished product
The values assigned to meat depend on the type of meat and the associated feeding and rearing methods, for example whether a grazing system was in place. → Learn more
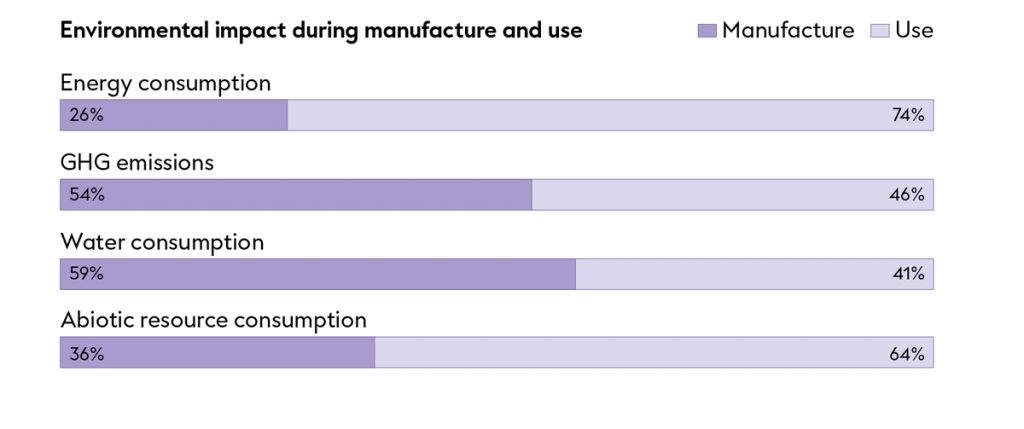
The IT System group within the task force looked specifically at the environmental impact of our IT systems. In 2020, the members of that group issued a preliminary report (in French only), which was reviewed by international experts. Their analysis focused on four indicators: greenhouse gas emissions, stress on fresh water, and depletion of energy and abiotic resources. The authors highlighted the difficulties they encountered in collecting reliable data and recommended conducting a more comprehensive audit that focuses on EPFL’s schools and colleges.
Our IT-related emissions were assessed from two perspectives (2019 data):
- Emissions from producing IT equipment (the manufacture of computers, laptops, screens, laptops, tablets, etc.): estimated at 4,829 tons CO2-eq per year
- Emissions from using IT equipment (including data centers): estimated at 15,300 MWh per year, or approximately 2,000 tons CO2-eq per year. This corresponds to 25% of our School’s power-related emissions
Somewhat surprisingly, the manufacture of IT equipment generates more than double the of carbon emissions than its use.
Including our IT-related emissions in our carbon footprint calculations has helped us get a more accurate measurement. An estimated 14% of our greenhouse gas emissions come from our use of digital technology, including 10% from the manufacture of IT equipment and 4% from IT-related power use.