Rare is Interesting: Connecting Spatio-Temporal Behavior Patterns with Subjective Image Appeal
Proceedings of the 2nd ACM international workshop on Geotagging and its applications in multimedia
2013
The 21st ACM International Conference on Multimedia, Barcelona, Spain, October 21-25, 2013.p. 31-36
DOI : 10.1145/2509230.2509234
The NMDC Dataset
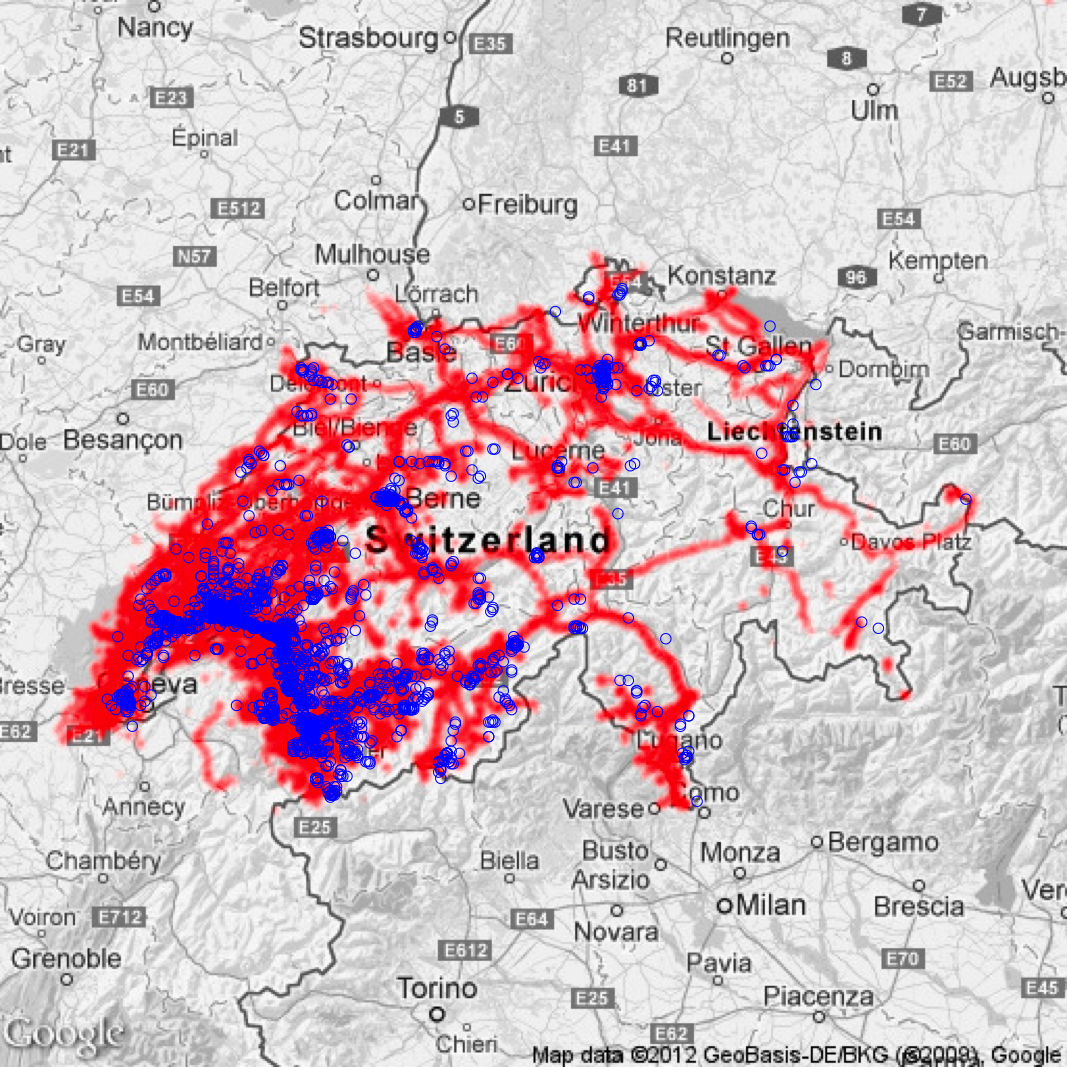
The NMDC dataset includes smartphone usage information and various sensor data collected in Switzerland during approximately two years. In our analyses, we use over 10 million GPS data points (time, location) that belong to 166 NMDC participants. In addition, the participants took a photograph at 17’000 of these GPS data points. In Figure 1, the GPS density map of the participants and the GPS positions of the collected photographs are overlaid on the map of Switzerland.
Time- and Location-Based Events
In order to represent the NMDC participants’ behavior patterns, we use the GPS data points to extract time- and location-based events. We define the following types of events:
- Event: We define an event as a limited spatial and temporal interval, in which the GPS data points of an NMDC participant do not change significantly. We extract over 90’000 events from 10 million GPS data points.
- Rare and Repeating Events: Events are indicated as “rare”, if there exist less than ten events for the same participant at close-by GPS coordinates. The inverse is true for repeating events.
- Photographically Interesting and Uninteresting Events: Events are indicated as “photographically interesting” (PI), if a participant took a photograph during that event. The inverse is true for “photographically uninteresting” (PU) events. We detect approximately 3’700 PI events and 86’300 PU events in the NMDC dataset.
 |
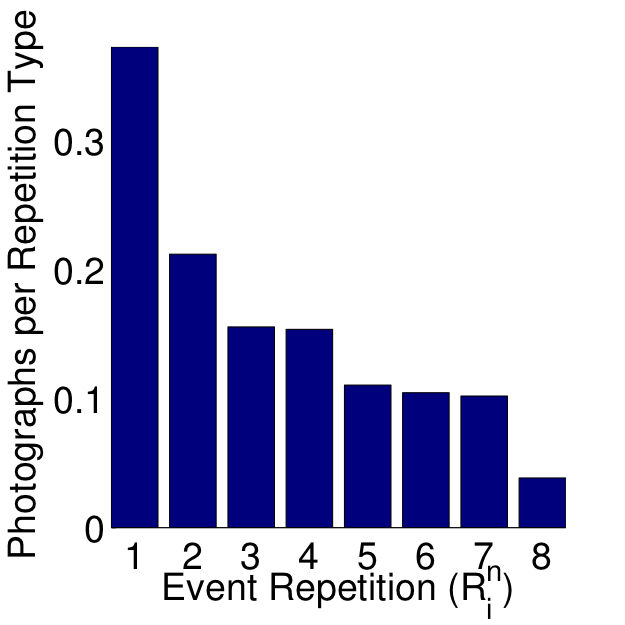 |
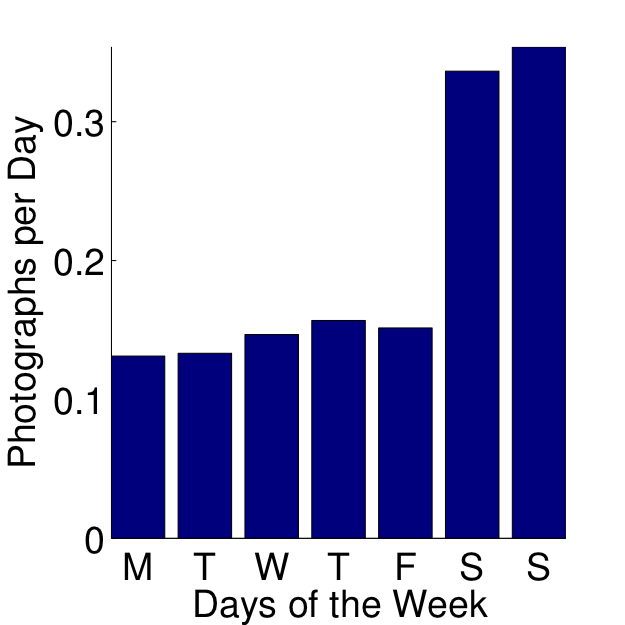
Figure 2: Effect of (left) the days of the week and (right) event repetition on the photograph collection.
The Flickr Dataset
We retrieve over 36’000 geotagged photographs from Flickr. This dataset is formed by downloading all the geotagged photographs within a 100m radius of each event center coordinate and within the NMDC data collection duration of two years. Along with the images, we also get the following Flickr image statistics:
- View Count: The number of people who viewed the image (all retrieved images were viewed more than 20 times).
- Favorite Count: The number of people who added the image to their favorite images list.
These values can be considered as outputs of a psychophysical test. We will treat the ratio of favorite count to view count as the “image appeal rating” of an image.
 |
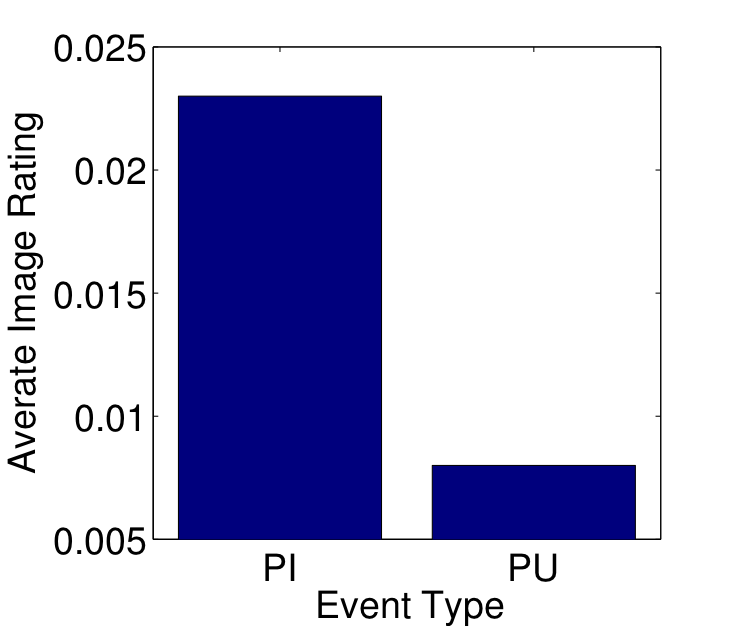 |
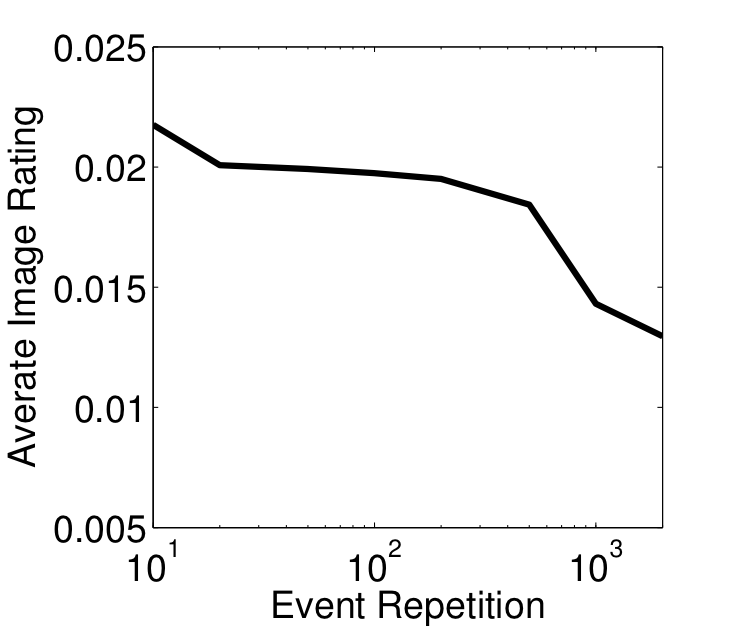
Figure 3: The average image appeal ratings (left) for PI and PU events (right) for different event repetitions.
Evaluation and Results
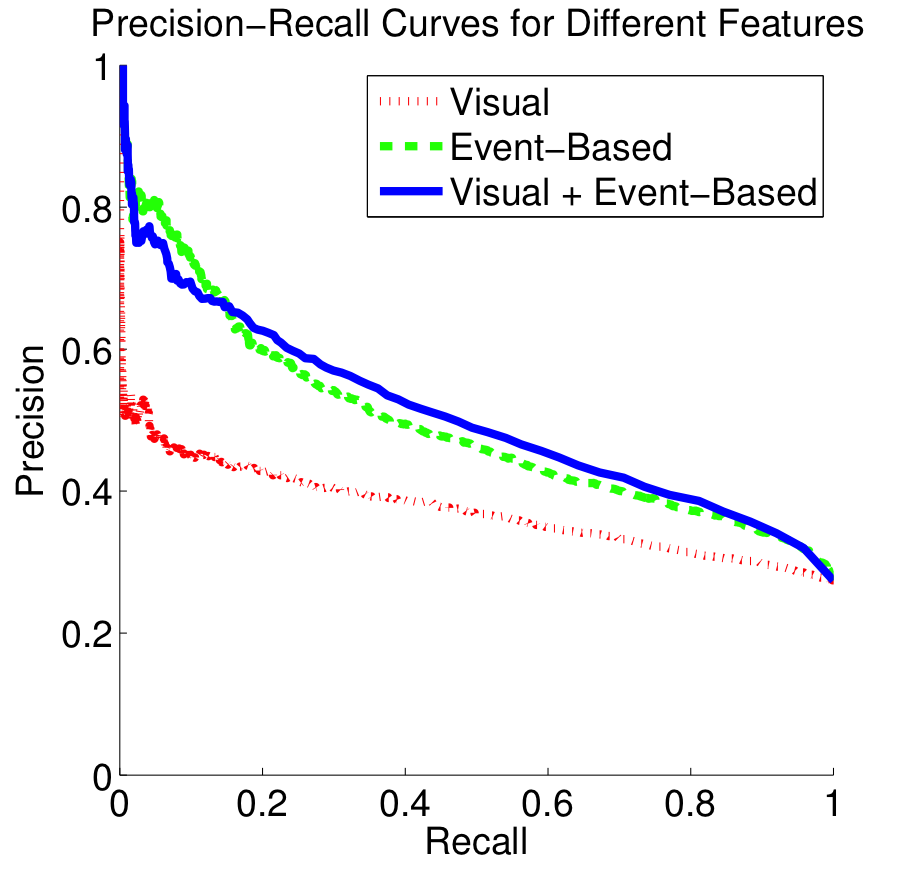
In our evaluations, we randomly divide the 36’000 Flickr images into equal-sized training and test partitions. We then create 32 regression trees by randomly selecting (with replacement) 80% of the training examples for every tree. The input of a regression tree is a feature vector, and the ground truth is the image appeal ratings. We train regression trees under three setups: visual features only, event-based features only, and both feature vectors. When we test an image to get a final image appeal rating estimation, we pass the extracted features through all trees and average the regression output. The appeal rating prediction is not directly a curve-fitting problem. Thus, to evaluate the performance of our method, we use the Spearman’s rank correlation test.
| Method | Spearman’s Coefficient | Extraction Time |
| Visual | 0.3488 ± 0.0050 | 0.1638 s |
| Event-Based | 0.4740 ± 0.0040 | 0.0043 s |
| Visual+Event-Based | 0.4913 ± 0.0033 | 0.1681 s |
Table 3: Spearmen’s ρ values for individual and combined feature sets averaged over ten experiments.