Abstract
The accurate measurement of reflectance and transmittance properties of materials is essential in the printing and display industries in order to ensure precise color reproduction. In comparison with reflectance measurement, where the impact of different geometries (0°/45°, d/8°) has been thoroughly investigated, there are few published articles related to transmittance measurement. In this work, we explore different measurement geometries for total transmittance, and show that the transmittance measurements are highly affected by the geometry used, since certain geometries can introduce a measurement bias. We present a flexible custom setup that can simulate these geometries, which we evaluate both qualitatively and quantitatively over a set of samples with varied optical properties. We also compare our measurements against those of widely used commercial solutions, and show that significant differences exist over our test set. However, when the bias is correctly compensated, very low differences are observed. These findings therefore stress the importance of including the measurement geometry when reporting total transmittance.
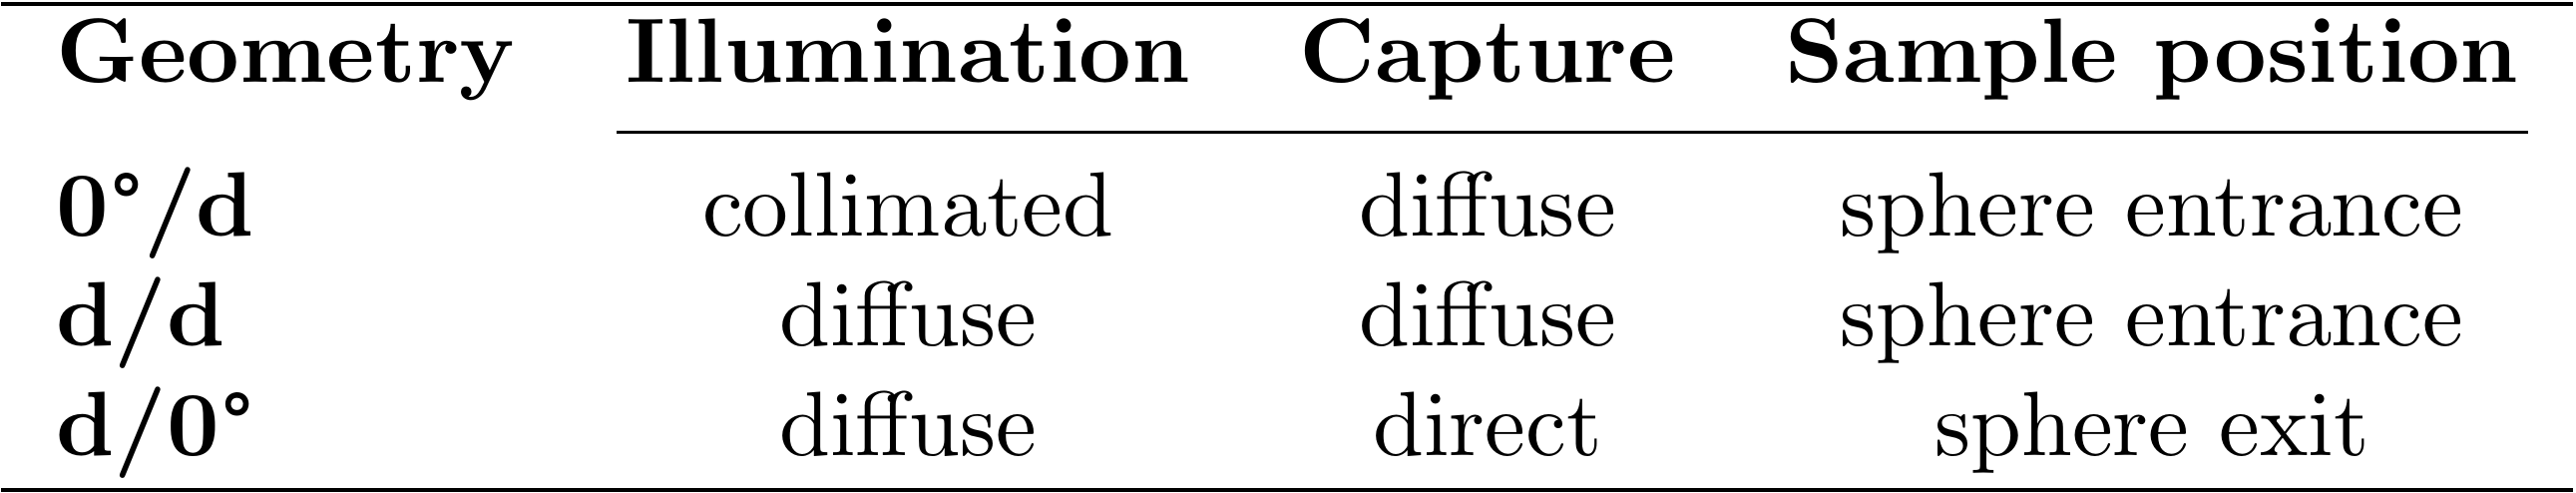
Evaluated geometries
For our experiments we built a custom optical setup. It comprises an illuminating optical fiber connected to a Dolan-Jenner DC-950-HR illuminator, an iris diaphragm or opal glass (configuration dependent), an integrating sphere and an optical fiber connected to a Maya2000 Pro spectrometer.
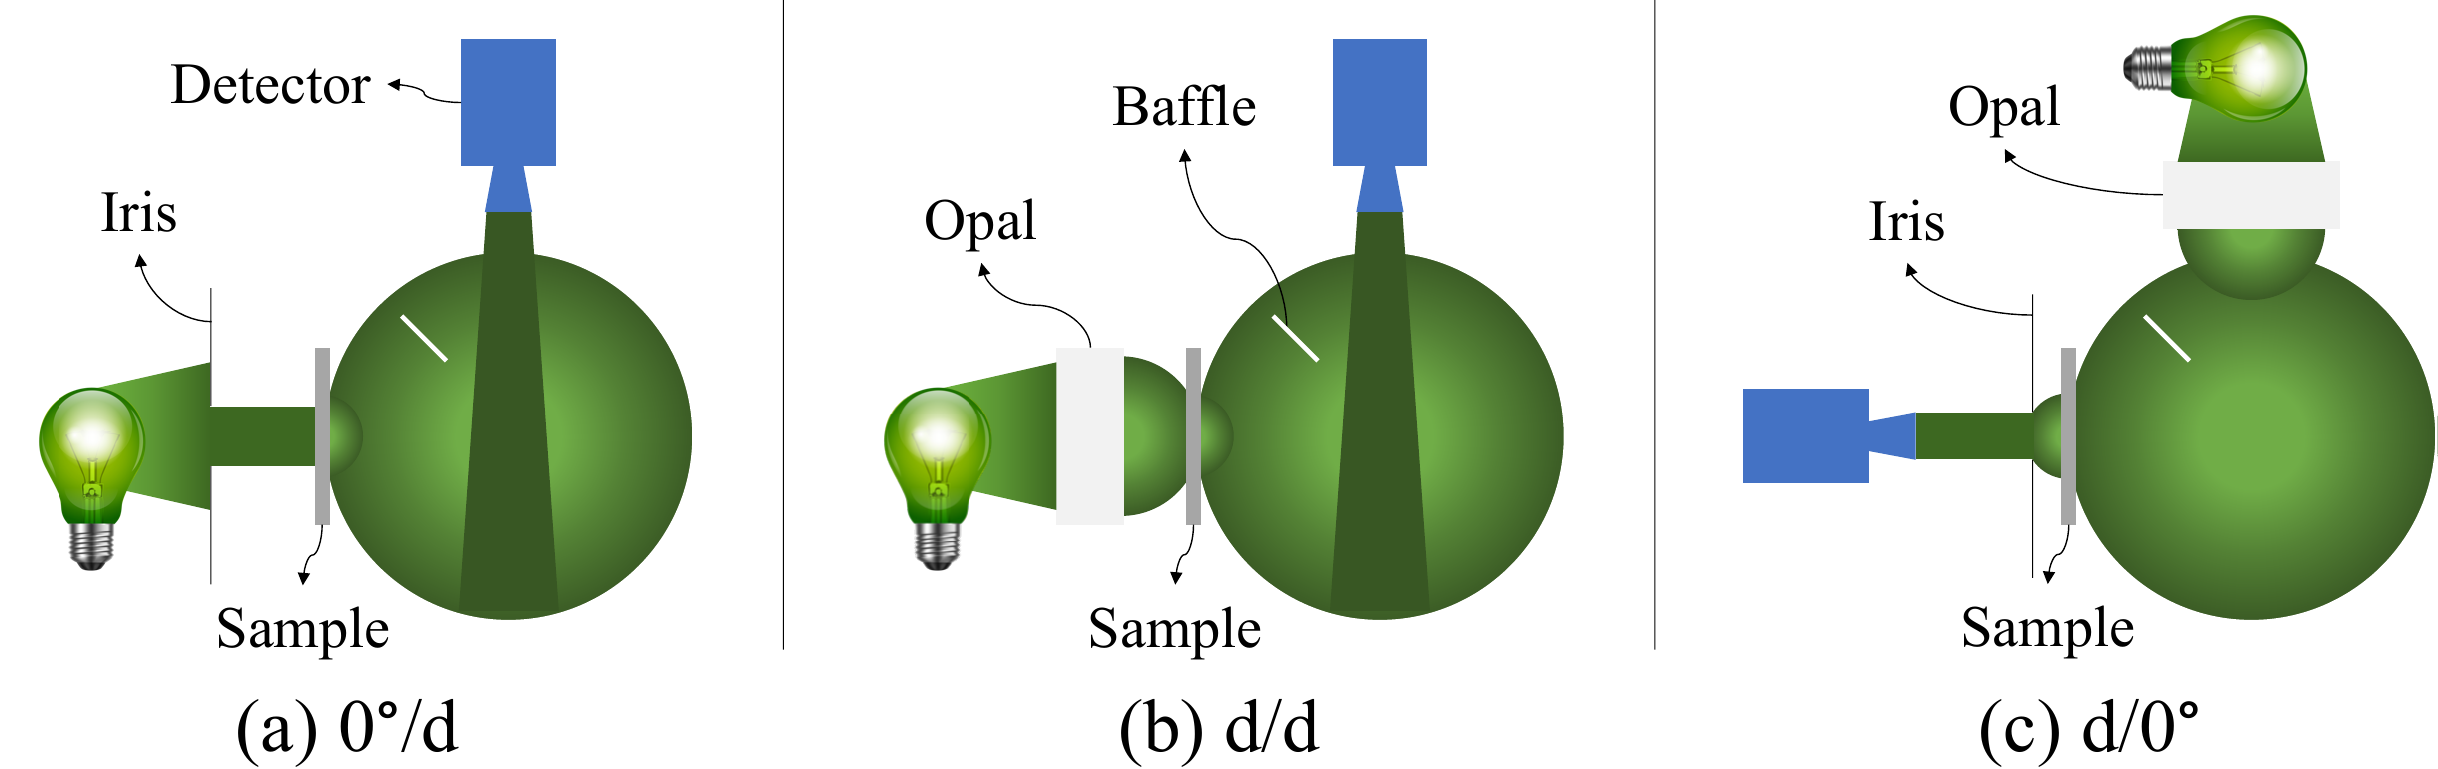
The set of measurement geometries that we have evaluated with our custom setup. They enable us to capture total transmittance. The details of these geometries can be found in the following table:
Sample set
For our experiments, we created a test set of 16 samples based on their varied reflecting, absorbing and scattering characteristics. The list of samples together with their total transmittance can be found in the legend of the following figure, where they are sorted by their average transmittance. The samples are fairly devoid of color, since they are used as print media. In the following, we consider the first three samples to be transparent (displayed in solid lines) and the rest to be diffusing (displayed in dashed lines).
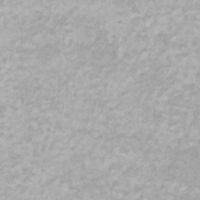
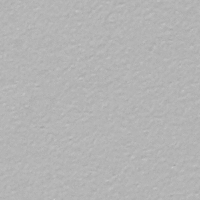
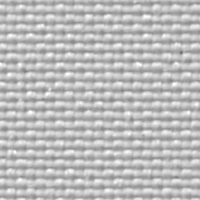
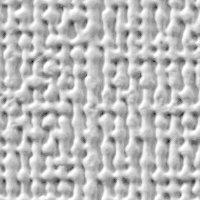
An example set of the samples’ surface texture can be seen in the figure below. The IJM 683 is a glossy, transparent, adhesive plastic film. MPI 3151 is a satin, white, translucent, adhesive vinyl. The Lumitex 195 is a fine coated polyester fabric, and the Decomural Coating is a matt, textured vinyl with a very rough surface. Finally, the IJM 611 is a latex saturated poster paper.
 |
 |
 |
 |
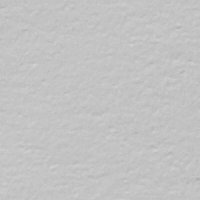 |
| (a) IJM 683 | (b) MPI 3151 | (c) Lumitex 195 | (a) Decomural Coating | (a) IJM 611 |
Results
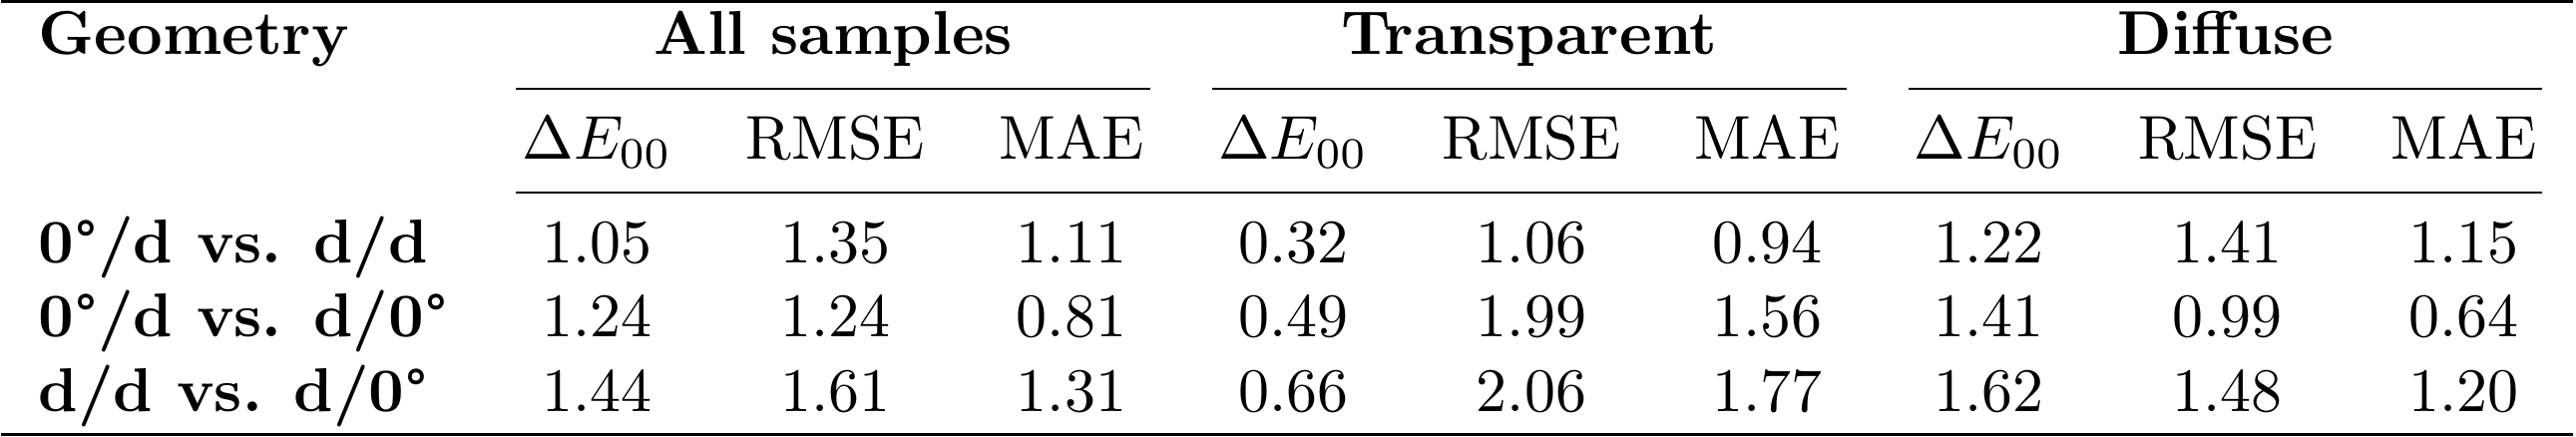
We compare the differences over all samples, but we also show them for only the transparent and diffuse sets of samples. For computing the differences, we used the MAE, RMSE, and ∆E00 error metrics. The transmittance values were expressed in percentage.
Table 1 compares the transmittance measurements of the set of samples obtained using our custom setup. The measurement geometries and the set of samples that we used are detailed above.
In addition to studying the effects of different measurement configurations, we also compare our results to those from commercially available solutions, namely the Agilent Cary 5000 and the X-Rite Color i7. The comparison is summarized in Table 2.
