Disclaimer
This page is meant as a brief introduction to the topic, it provides an overview and the functions needed to replicate the work. For the full technical details, the reader is referred to the paper. All codes can be freely used as long as the work is correctly referenced. Please contact Majed El Helou about any potential errors or for clarification.
An Overview
Near-Infrared, or NIR, is the waveband ranging roughly from 700 to 1000nm. Many details about its acquisition and its applications can be found on the lab website. This page is dedicated for looking into the relations between NIR and visible light, as well as deblurring NIR.
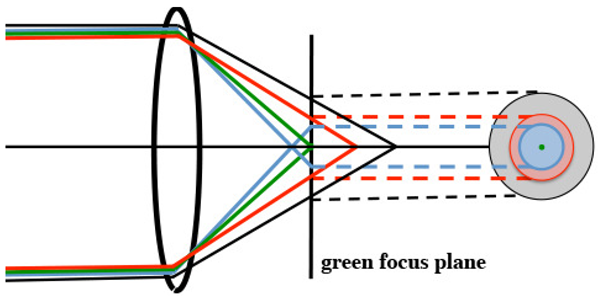
Camera lenses have a refraction index that depends on wavelength, therefore in hyperspectral imaging only one band is in focus (special cases being beyond the scope of this description), as can be seen in the below image.
But before getting into deblurring, we first take a look at any links we can find between color and NIR.
We spatially look at the normalized cross correlation (NCC) between different color bands by studying the NCC locally on image patches with a certain percentage overlap with this MATLAB function. (PS: if you want the result to be redundantly spread across every patch, and to handle all border cases relative to patch sizes, this function can be used). And we obtain a spatial correlation image as the one below (obtained with 50×50 patches overlapping at 80%):
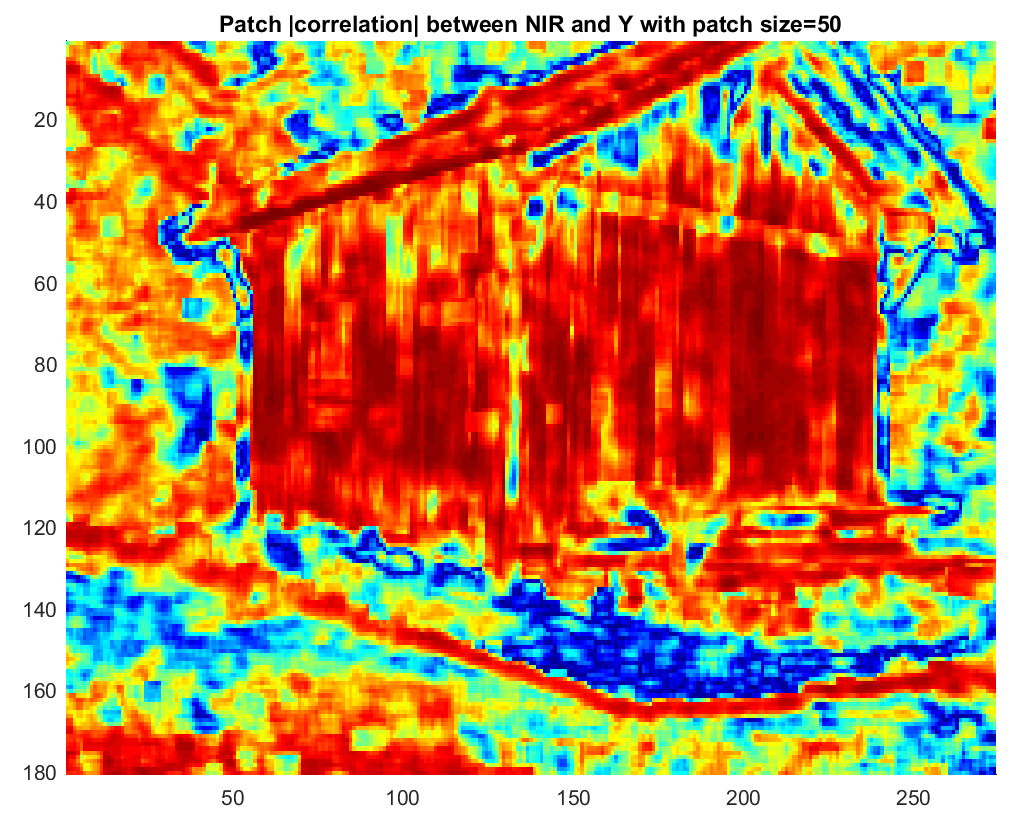
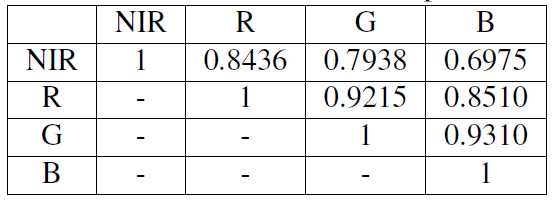
As expected, high spatial frequency regions or edges have the highest correlation across spectral bands. Also predictable is the fact that channels that are closer on the EM spectrum have higher correlation, which is shown in the following NCC table (computed over a dataset of 72 images available on our webpage):
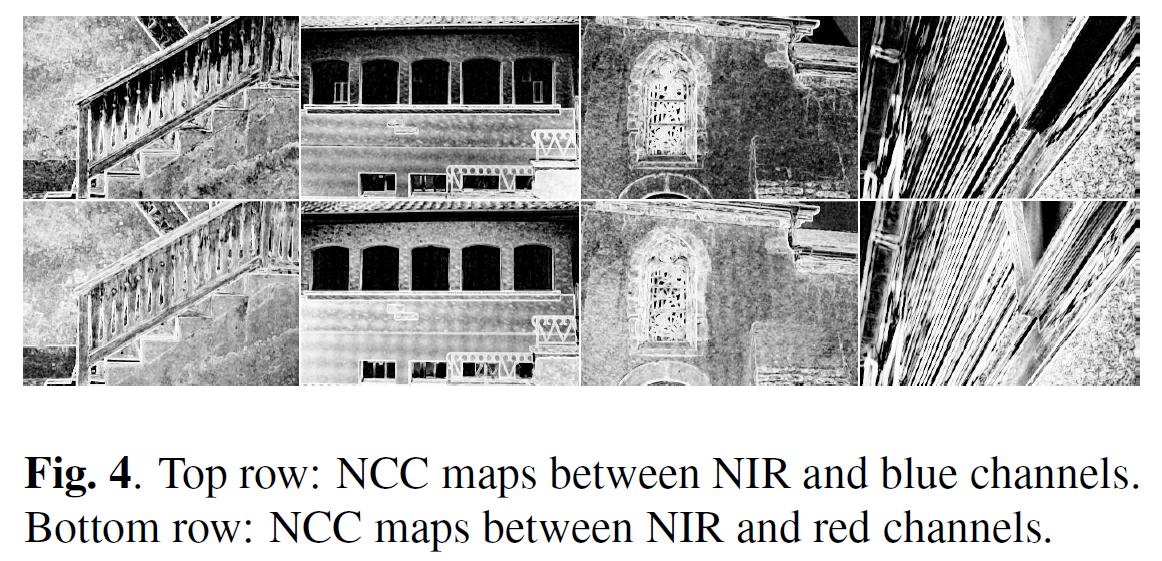
What is however interesting, is that as a result of a combination of chromatic aberration and reflective properties of materials in a scene, the spectral correlation varies spatially depending on the scene at hand. Not to be confused with what we call the spatial correlation that is due to spatial high frequencies. And so, the below images which one would expect to be practically identical, turn out to hold a few surprises.
By leveraging the most suited spectral band (among RGB) at every spatial location, our NIR deblurring improves the Crete sharpness by 48.8% on average (Crete function) relative to the state of the art. With similar results obtained based on a sharpness measure that we compute with Sobel gradients (Sobel sharpness function).
Deblurring Optimization
The image deblurring optimization function, called MSDeblur in the paper, is explained in detail in the paper “Multiscale guided deblurring: Chromatic aberration correction in color and near-infrared imaging” which can be found on the IVRL publications list, and the code for it can be downloaded here.
For an explanation of how to mathematically solve image optimizations, and how to translate the solution into a computationally tractable form, please refer to the tutorial on the sub-page “Optimizing over Millions of Variables”.