Abstract
Yildirim, Gökhan and Süsstrunk, Sabine
12th Asian Conference on Computer Vision, Singapore, Singapore, November 1-5, 2014.
Fast and accurate salient-object detectors are important for various image processing and computer vision applications, such as adaptive compression and object segmentation. It is also desirable to have a detector that is aware of the position and the size of the salient objects. In this paper, we propose a salient-object detection method that is fast, accurate, and size-aware. For efficient computation, we quantize the image colors and estimate the spatial positions and sizes of the quantized colors. We then feed these values into a statistical model to obtain a probability of saliency. In order to estimate the final saliency, this probability is combined with a global color contrast measure. We test our method on two public datasets and show that our method significantly outperforms the fast state-of-the-art methods. In addition, it has comparable performance and is an order of magnitude faster than the accurate state-of-the-art methods. We exhibit the potential of our algorithm by processing a high-definition video in real time.
Our Code
You can find our source code and the necessary information to compile and to run it in this file:
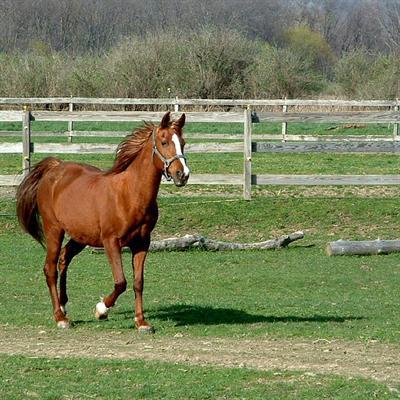
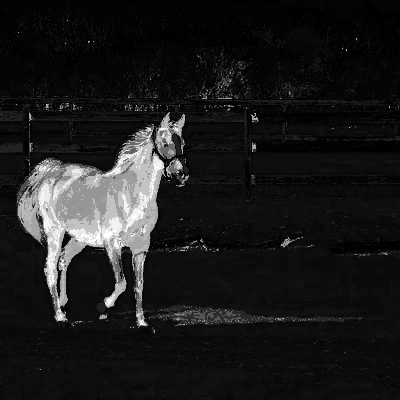
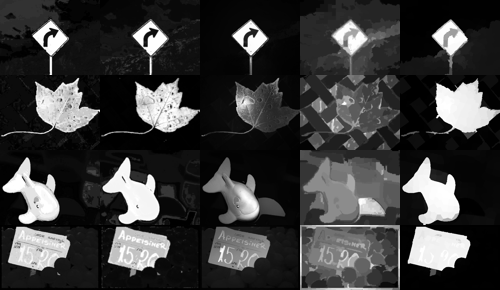
Our Saliency Maps
Here, you can find the saliency maps that are generated by our method:
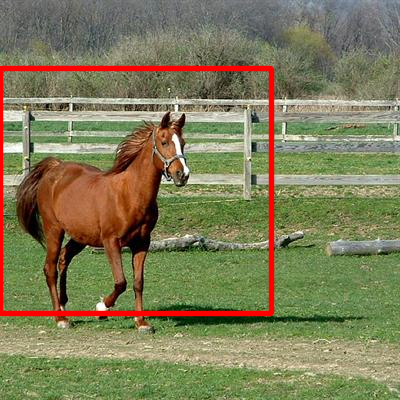
Our Detection Rectangles
You can find the detection rectangles our method produces in the links below:
Introduction
Saliency detection is a pre-processing step, it should process the image in an efficient and accurate manner and provide as much information as possible for the successive step. In this paper, we satisfy the efficiency, accuracy, and information criteria by introducing a Fast, Accurate, and Size-Aware (FASA) salient object detector.
 |
 |
| (a) Original Image | (b) Position & Size |
 |
 |
| (c) Saliency Map | (d) Ground Truth |
Figure 1: FASA processes (a) the 400 × 400 pixel image in 6 milliseconds and outputs (b) the parameters of rectangles that enclose the salient objects and (c) a saliency map, which is comparable to (d) the ground truth.
Our Method
Our saliency-detection method, FASA, combines a probability of saliency with a global contrast map. Figure 2 provides a scheme illustrating our method. For computational efficiency, our algorithm first quantizes an image to reduce the number of colors. Then, in order to estimate the position and the size of the salient object, the spatial center and variances of the quantized colors are calculated. These values are put in an object model to compute the probability of saliency. The same quantized colors are used to generate global contrast values as well. Finally, the saliency probabilities of the colors and the contrast values are fused into a single saliency map.
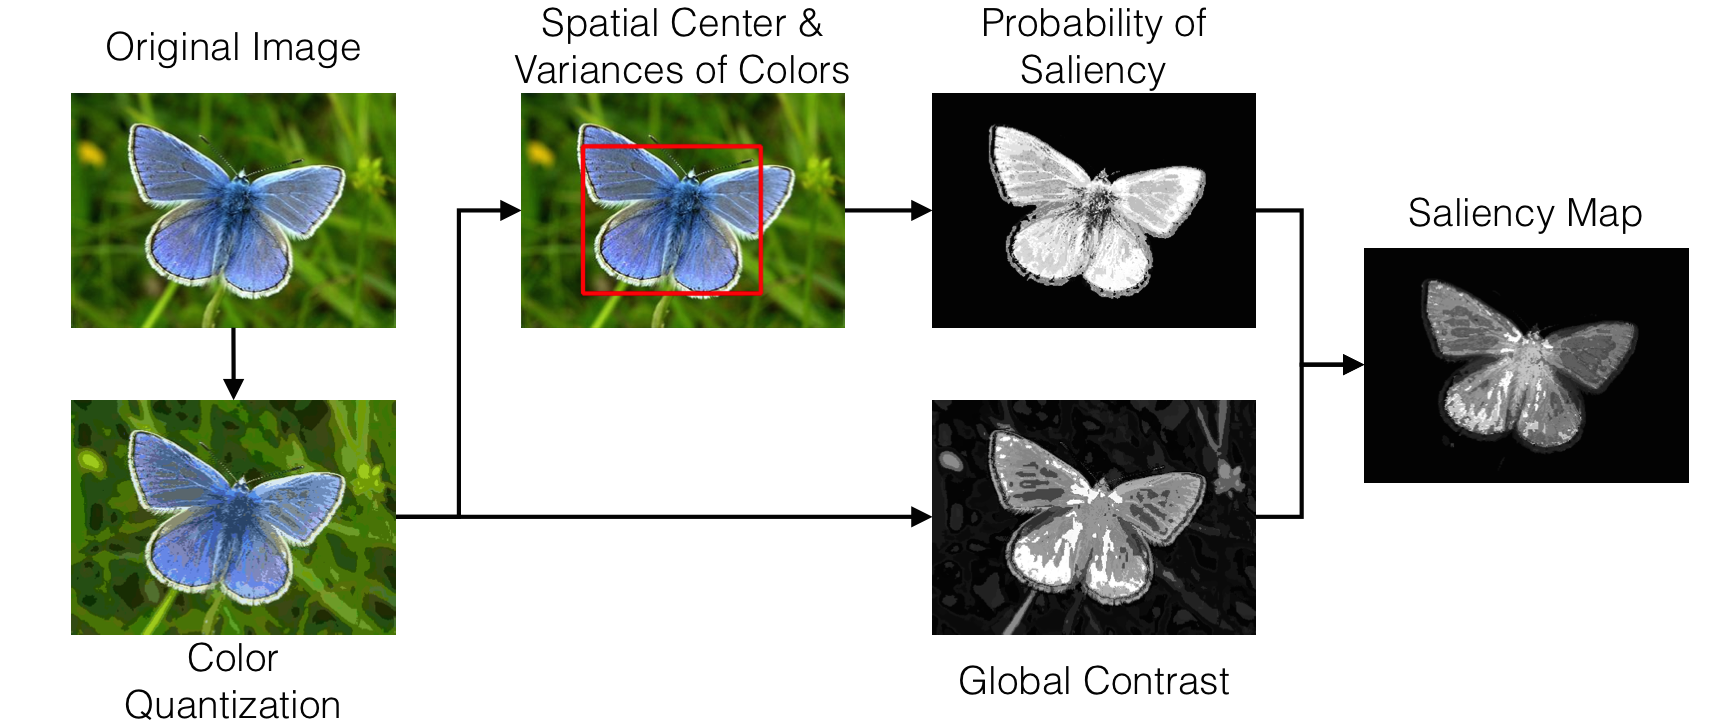
Color Quantization
The colors of an image are quantized (i.e., a color histogram is created) into a set of colors. In practice, we can minimize the number of colors by assigning certain quantized colors that have very few pixels to the perceptually closest quantized color with a non-zero number of pixels. We quantize the image in perceptually uniform CIEL*a*b* color space. An example of the color quantization is given in Figure 3.
 |
 |
 |
| (a) Original Image | (b) 175 quantized colors | (c) 50 quantized colors |
Figure 3: The L*a*b* histogram (8 bins in each channel, 83 = 512 bins in total) of (a) the original image contains (b) 175 quantized colors with non-zero histogram bins and (c) 50 quantized colors that can cover 95% of the image pixels.
The Center and Size of a Salient Object
The spatial center of an object is related to the color-weighted center of mass of a quantized color of the image. Whereas, the spatial variances of c can be used to compute the size of an object (see the paper for detailed explanations).
Probability of Saliency
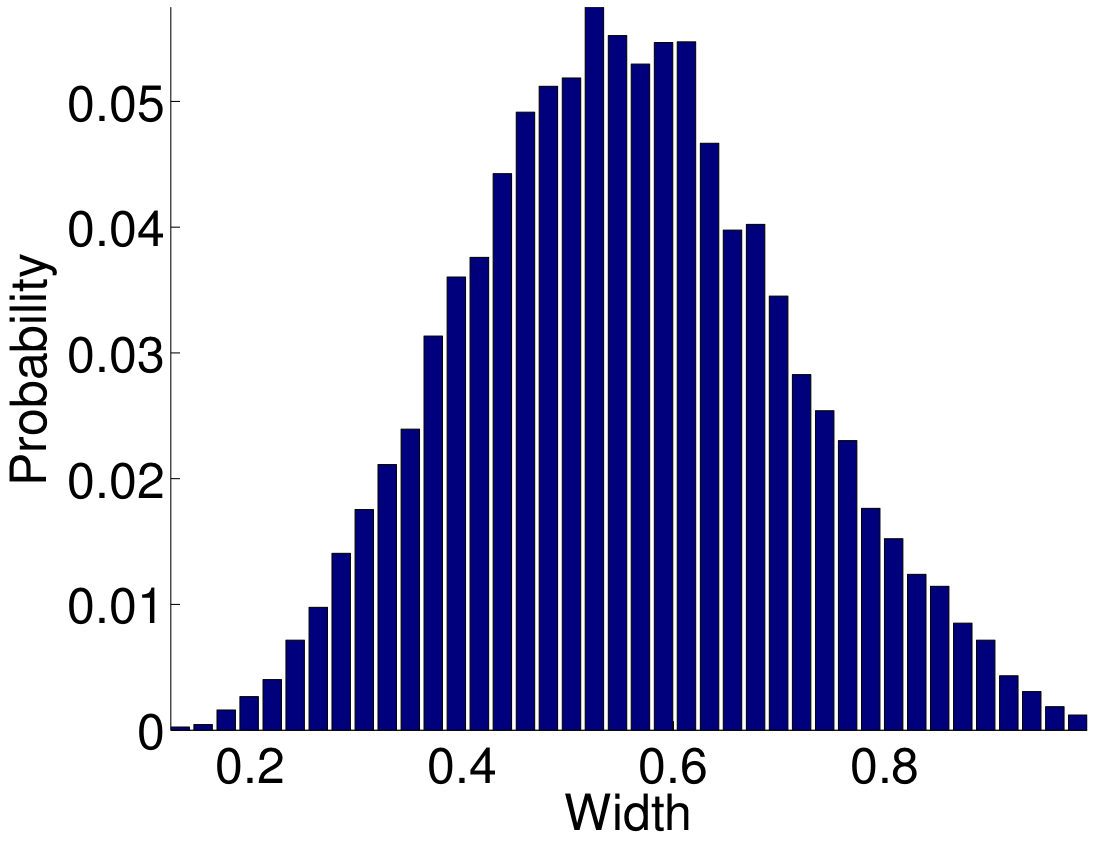
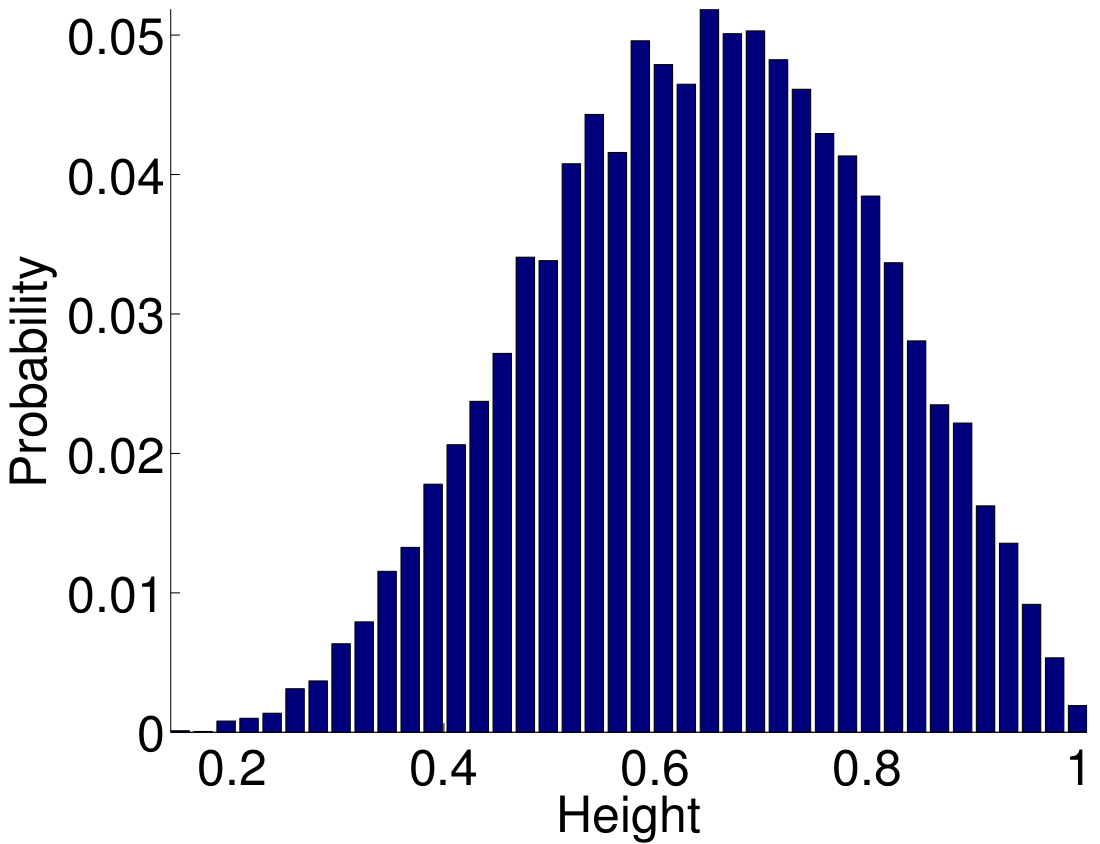
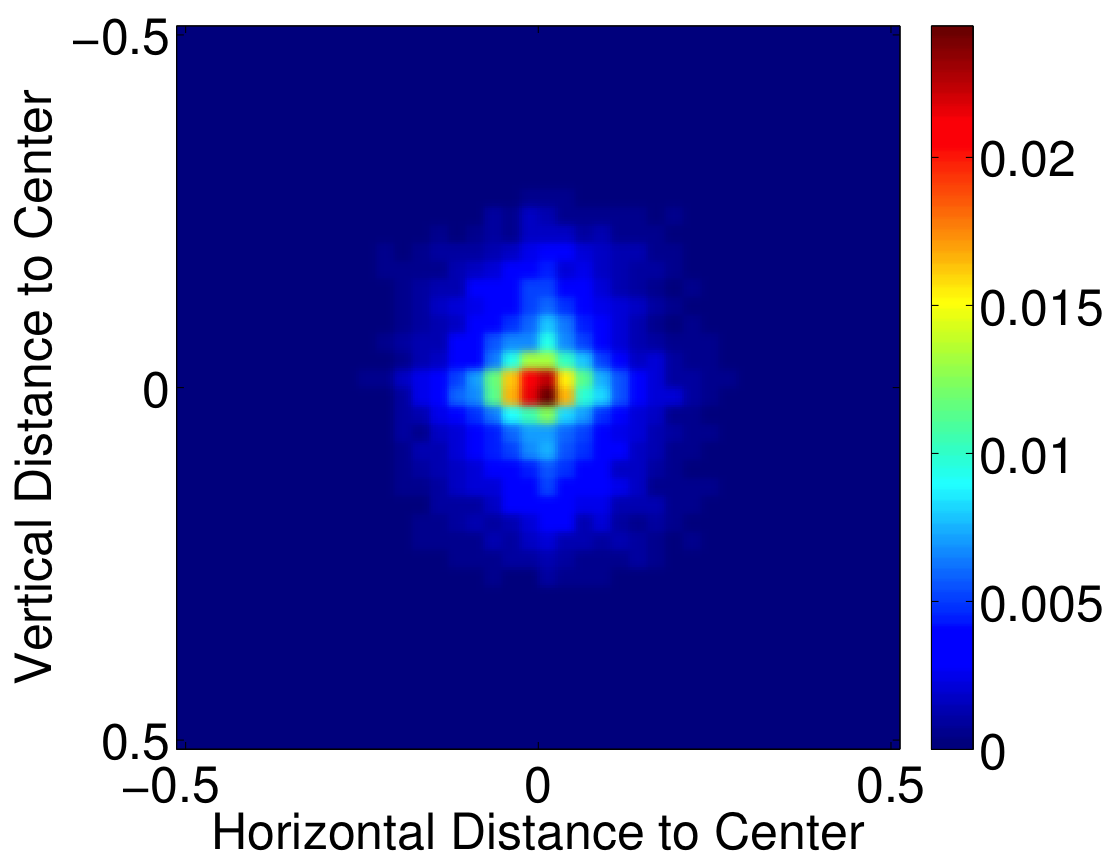
We can see in Figure 5 that all probability distributions resemble a Gaussian distribution. Therefore, we model their joint distribution with a multivariate Gaussian function given as follows. In our method, we estimate the position and the size of the salient object, thus we can statistically model a mapping from these variables to a saliency probability. To generate our model, we use the MSRA-A dataset [1] that includes over 20’000 images with salient objects and their enclosing rectangles marked by three persons. In Figure 4, we illustrate the probability distributions in terms of the width and the height of the salient objects, as well as their distance to the image center.
 |
 |
 |
| (a) | (b) | (c) |
Figure 4: Distributions of object (a) width (b) height, and (c) distance to image center in the MSRA-A dataset [1] based on the ground truth rectangles. All values are normalized by using the image dimensions.
We can see in Figure 4 that all probability distributions resemble a Gaussian distribution. Therefore, we model their joint distribution with a multivariate Gaussian function.
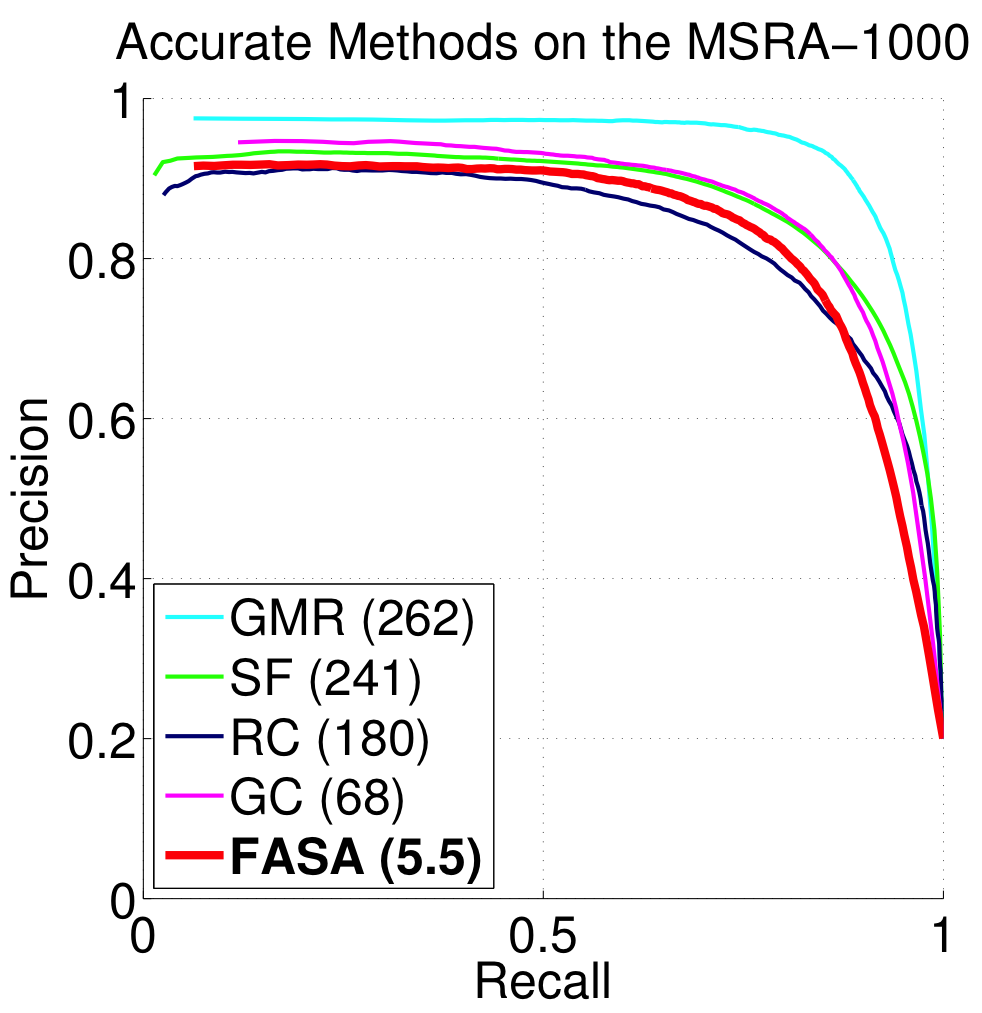
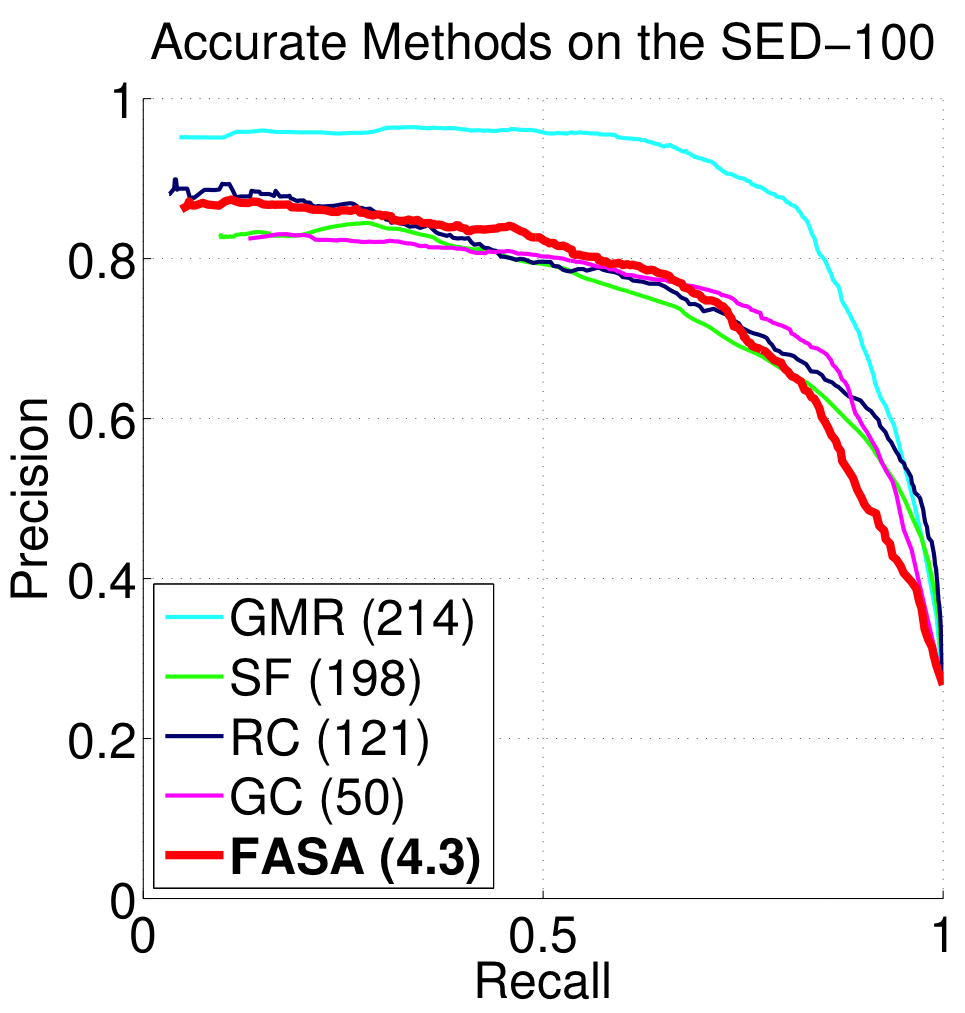
Results: Fast
The color quantization step greatly reduces the computational complexity of our method while still retaining the saliency accuracy. Our algorithm estimates the visual saliency of an image in the MSRA-1000 and the SED-100 datasets in, on average, 5.5 and 4.3 ms, respectively. The comparison of execution times is given in Table 1. Note that the most time consuming step (superpixel segmentation) in GMR is implemented in C++ and it processes the MSRA-1000 images in approximately 200 ms, on average.
Table 1: Average computation time (in milliseconds) for the MSRA-1000 and the SED-100 datasets.
| Accurate | Fast |
| GMR | SF | RC | GC | FT | HC | LC | FASA | |
| MSRA-1000 [2] | 262 | 241 | 180 | 68 | 16 | 12 | 3 | 5.5 |
| SED-100 [3] | 214 | 198 | 121 | 50 | 13 | 10 | 3 | 4.3 |
| Code | Matlab/C++ | C++ | C++ | C++ | C++ | C++ | C++ | C++ |
Our method is fast enough to use it as a real-time salient-object detector in videos. Furthermore, it provides the position and size information for the salient and non-salient parts of the image. This property can be used in applications such as object tracking in videos. In order to demonstrate the potential of FASA, we estimate, using different resolutions, the saliency of the publicly available video “Big Buck Bunny”. We are able to process the HD version (1280 × 720) of the video with a speed of 30 frames per second (fps).
Table 2: Average processing speed of FASA in frames per second (fps) for different resolutions of the video “Big Buck Bunny”.
| Resolution | ||||
| 1920×1080 | 1280×720 | 854×480 | ||
| fps | Frames per second | 13.7 | 30.7 | 66.5 |
| N | Number of megapixels | 2.07 | 0.92 | 0.41 |
| N x fps | Number of megapixels per second | 28.4 | 28.3 | 27.2 |
Results: Accurate
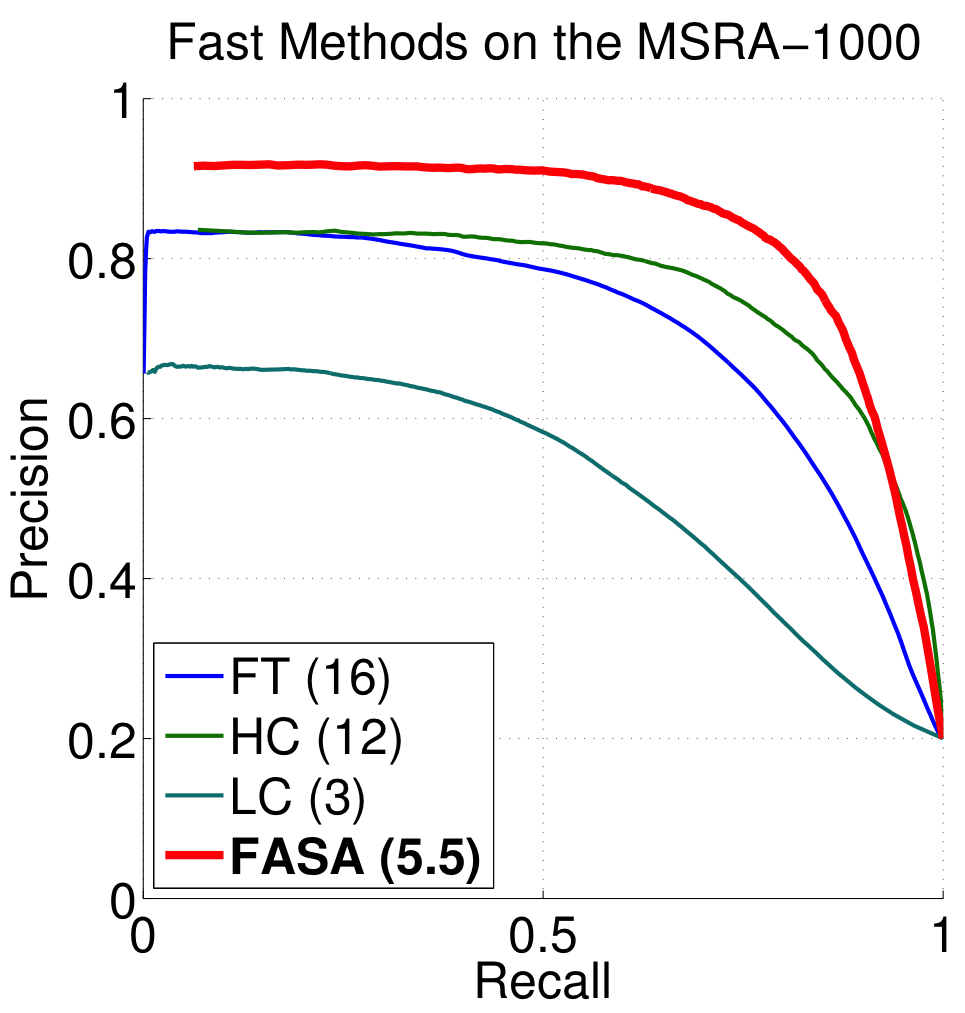
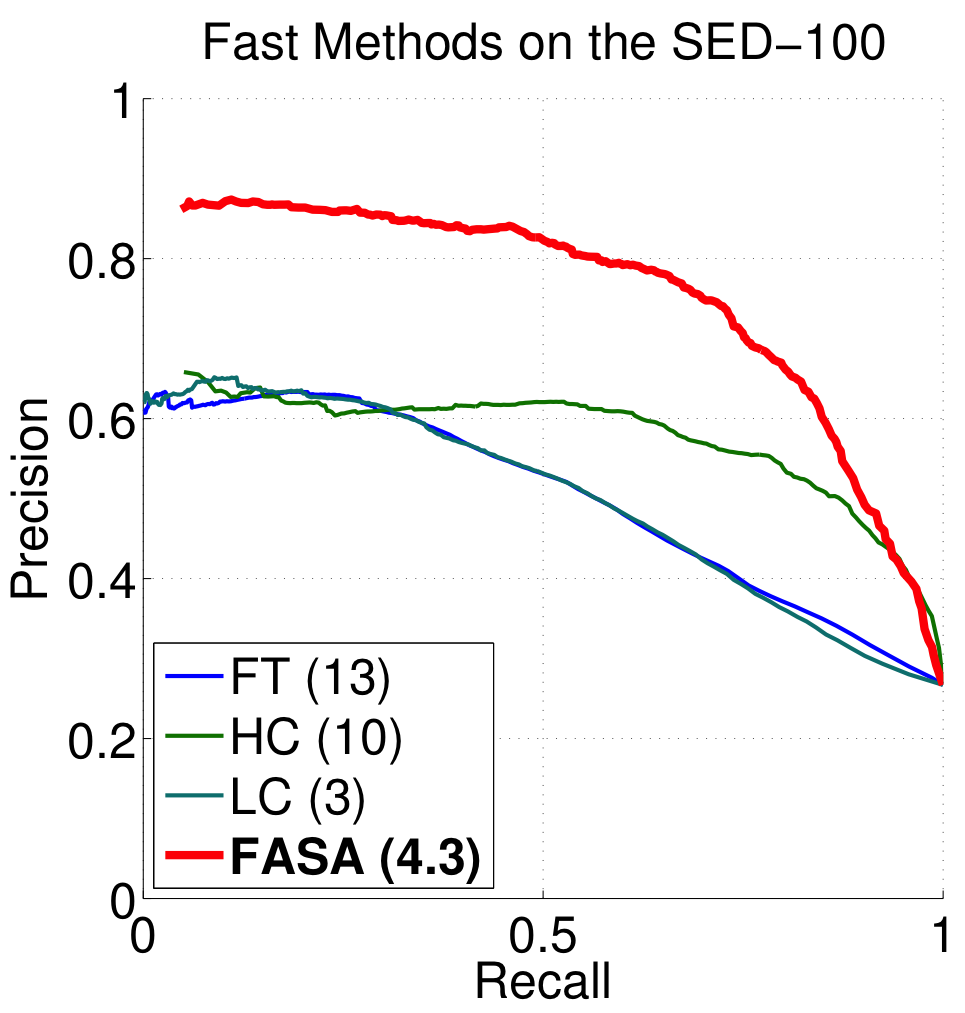
In Figure 6, we compare the precision and recall curves of our method with the other methods on the MSRA-1000 and SED-100 datasets. As it can be seen from Figure 6(a) and 6(b), our algorithm significantly outperforms the fast methods, such as FT, LC, and HC, because they only take the color contrast (global and/or local) into account. The local saliency-detection methods, such as SF and GC, also use the spatial variance as a part of their saliency computation. However, as stated before, they directly favor smaller objects by assuming an inverse correlation between the spatial variance and the object saliency. We use, instead, the position and the size information in a statistical model and, even though our method is global, we achieve an accuracy comparable to SF, GC, and RC and we are one order of magnitude faster.
 |
 |
| (a) | (b) |
 |
 |
| (c) | (d) |
Figure 5: Salient object detection performance of our method are compared to fast and accurate methods. The numbers in parentheses indicate the execution times of the corresponding methods.
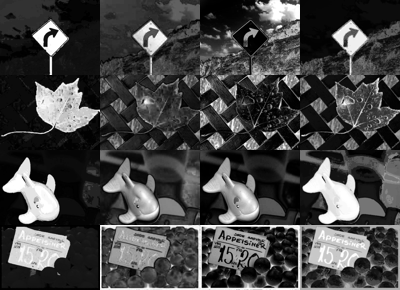
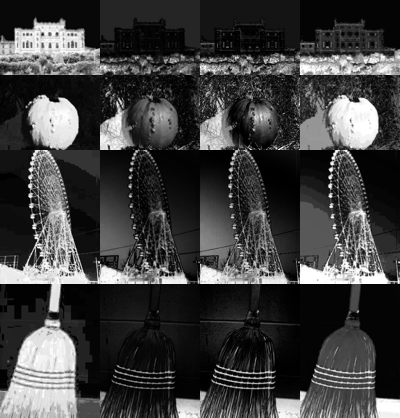
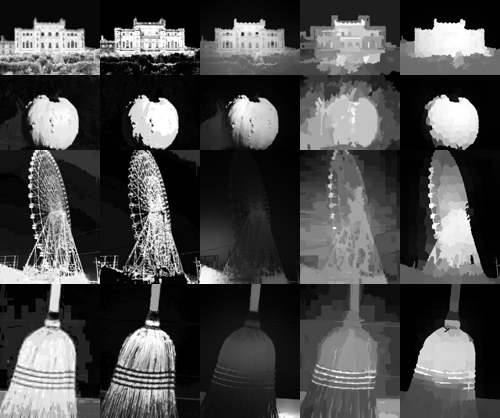
We visually compare the saliency maps generated by different methods in Figure 6. Due to the accurate quantization in CIEL*a*b* color space, our saliency maps are more uniform than the maps of LC and HC. Moreover, the background suppression of the probability of saliency is better than FT. Compared to the other fast methods, FASA generates visually better results. Our maps are visually comparable to the maps of the accurate methods, such as RC, GC, SF, and even GMR. Considering that FASA is one order of magnitude faster than these methods, our method may be preferable for time-critical applications.
 |
 |
 |
| (a) | (b) | (c) |
 |
 |
 |
| (d) | (e) | (f) |
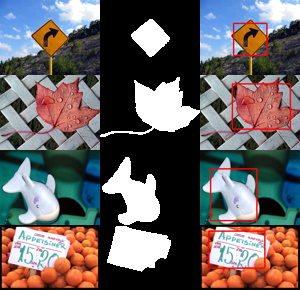
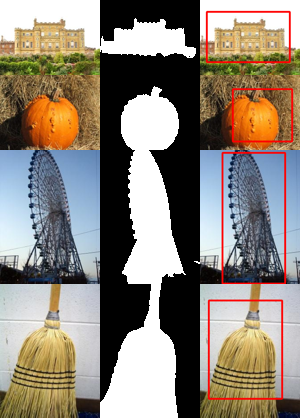
Figure 6: Four example images from the MSRA-1000 and the SED-100 datasets. (a,d) FASA estimates the position and the size of the objects (red rectangles). (b,e) Our saliency maps are better than the maps of the fast methods and (c,f) they are visually comparable to the maps of the accurate state-of-the-art methods (GT: Ground Truth).
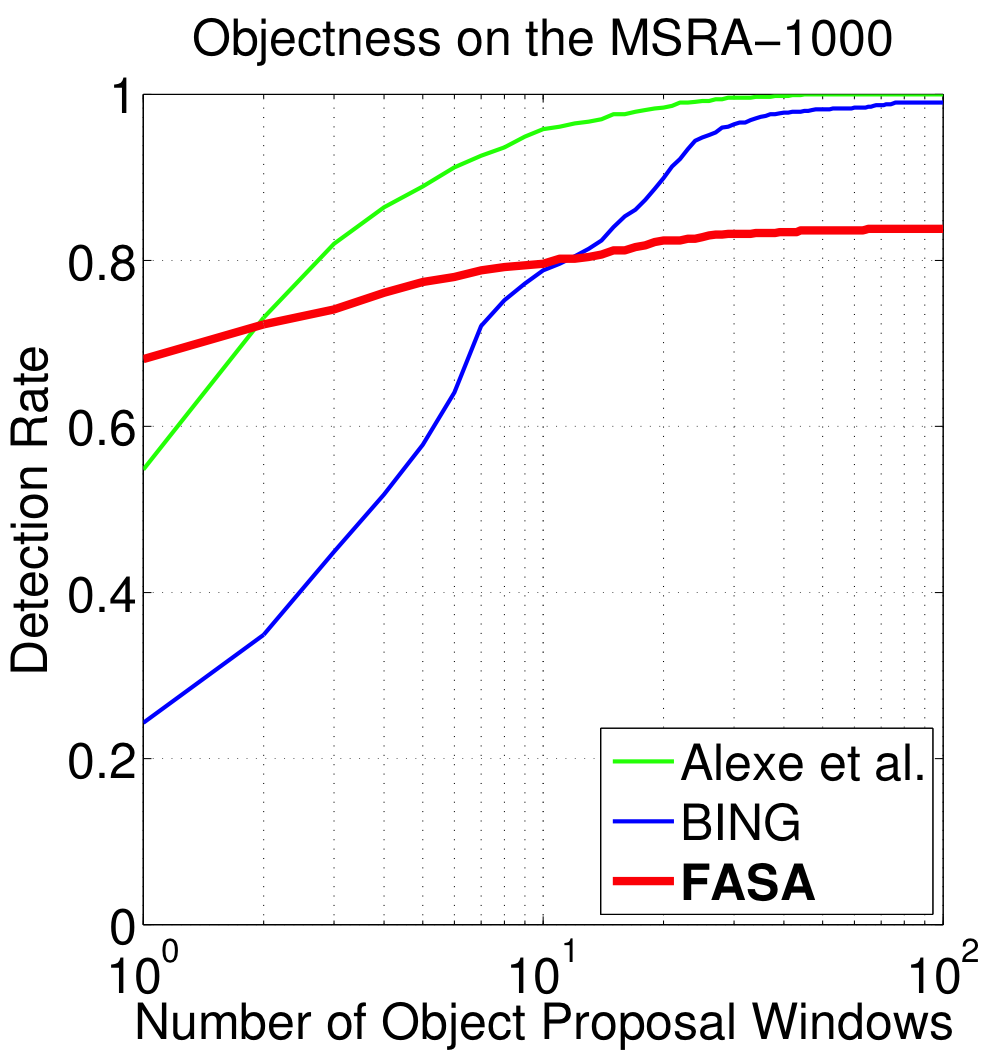
Results: Size-Aware
Our method outputs additional position and size information about salient objects, which can be considered as an “objectness” measure. Therefore, we com- pare the object-detection capabilities of FASA to well-known objectness measuring methods, such as Alexe et al. [4] and BING [5]. The object-detection rate (probability of detecting an object) versus the number of object proposal windows for the MSRA-1000 and the SED-100 datasets are illustrated in Figure 7(a) and Figure 7(b), respectively. Our method is more accurate if we just consider the first proposal window. This is logical as our method focuses on (and is optimized for) estimating the salient objects and provides object center and size as additional information. This property can be helpful to provide single and accurate proposals for object detection and tracking.
 |
 |
| (a) | (b) |
Figure 7: The objectness detection rate of our method is compared to other methods.
References
[1] Liu, T., Yuan, Z., Sun, J., Wang, J., Zheng, N., Tang, X., Shum, H.: Learning to detect a salient object. IEEE Transactions on PAMI 33 (2011) 353–367
[2] Achanta, R., Hemami, S., Estrada, F., Süsstrunk, S.: Frequency-tuned salient region detection. In: Proceedings of IEEE CVPR. (2009) 1597 – 1604
[3] Alpert, S., Galun, M., Basri, R., Brandt, A.: Image segmentation by probabilistic bottom-up aggregation and cue integration. In: Proceedings of IEEE CVPR. (2007) 1–8
[4] Alexe, B., Deselaers, T., Ferrari, V.: Measuring the objectness of image windows. IEEE Transactions on PAMI 34 (2012) 2189–2202
[5] Cheng, M.M., Zhang, Z., Lin, W.Y., Torr, P.H.S.: BING: Binarized normed gradients for objectness estimation at 300fps. In: Proceedings of IEEE CVPR. (2014)