Particle size measurement is the cornerstone of powder technology. Materials in a particulate form are used everyday in most industrial and household contexts. The size of the powder either for processing of high-tech ceramics used in the electronics of a mobile phone, or biomedical detection of tumours or salt in the kitchen deeply influences its physical properties – flowability, rate of dissolution for salt, magnetic properties of iron oxides among others. Our capacity to measure the particle size and size distribution is crucial for both the development of new materials and their use in application.
LTP has taken a keen interest in improving understanding and methods for particle size distribution for many years and has become one of leading expert laboratories in Europe in the field of particle size measurement. Several key publications illustrate their role in the field (1-6). In these papers various methods for particle size measurement from 2 nm to 1 mm have been investigated and evaluated. In particular the applicability of centrifugation methods compared to light scattering for assessing the applicability of nanosized transition aluminas for ink-jet coatings was critical in the project success (4). LTP has taken part successfully in a round robin test to produce standard nanpoparticles as a reference material organised by the Institute for Reference Materials and Measurements (IRMM). See “Interlaboratory comparison of methods for the measurement of particle size, effective particle density and zeta potential of silica nanoparticles in an aqueous solution” A. Lamberty, et al. http://irmm.jrc.ec.europa.eu/.
Nanosized Ceramic Particles – Nanometrology
With the natural trend towards miniaturisation and increasing efficiency, particles are becoming smaller and smaller for top-end applications in electronics (BaTiO3), transparent windows (Al2O3), biocompatible scaffolds (hydroxy apatite) and biomedical applications (iron oxide, ZnS). The size range where future applications and breakthroughs are to arrive are often below 100 nm and sometimes below 20 nm. In this ultrafine particle size range particle size measurement and particularly the distribution of particles sizes encountered in a powder sample becomes a non-trivial analytical challenge. Also the assessment of nanoparticle toxicity both at the work place and in aquatic media in the environment depend greatly on their characteristics and LTP are participating in 2 projects in the Swiss national foundation action NRP 64 «Opportunities and Risks of Nanomaterials». www.snsf.ch.
Non-spherical particles
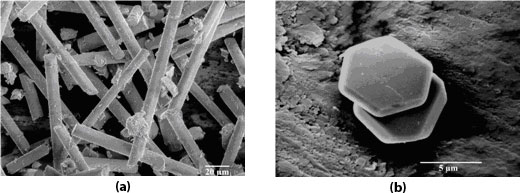
Most commercial instruments assume a spherical shape for data analysis which for anisotropically shaped particles such as discs or cylinders renders data interpretation difficult or even incorrect. LTP has investigated both model anisotropic particles with regular cylindrical or platelet morphologies as well as real anistropic particles such as clays (plates) or precipitated copper oxalate (rods). Different methods such as microscopy, centrifugal methods (photocentrifuges or X-ray sedimentometers) and laser diffraction have been applied. The results are compared with image analysis results after considering the hydrodynamic behaviour in the sedimentation methods and light scattering for the optical based methods.
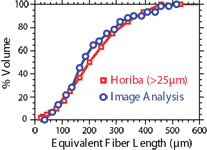
- Cylindrical glass fibres
Some very promising results are found when comparing results from the photocentrifuge with image analysis data, allowing a rapid and more representative measurement of the distribution. Laser diffraction on the other hand showed very poor correlation with the fibre length and can even result in bi-modal distributions representative of length and diameter of the elongated particle. - Alumina platelets
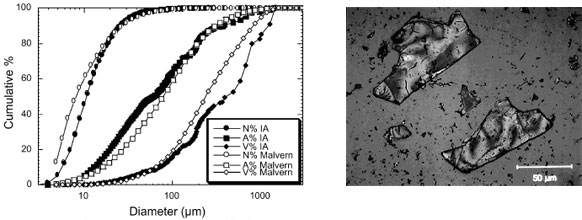
Results showed poor correspondence between the photocentrifuge and image analysis results. Laser diffraction, after calculations assuming alignment of the model alumina platelets in the sample cell and compensation for the spherical volume, give reasonable correspondence for the median diameters when compared with the image analysis results. - Rods and plate-like mica
Similar correlations were found for the precipitated copper oxalate rods (photocentrifuge and image analysis) and for plate-like mica particles (laser diffraction were particles aligned and image analysis) (3).
Good correlation is limited to cases where either the aspect ratio (length/thickness or length/diameter) or the minor dimension (thickness or diameter) could be considered constant – otherwise more indirect empirical approaches have been used to characterise the PSD delivered by instruments using an equivalent spherical diameter (ESD) for particles that are shown to be anisotropic.
Other techniques
- Specific Surface Area (SSA, nitrogen adsorption)
- X-ray Powder Diffraction (XRD, phase and crystallite size from line broadening)
- Electron Microscopy – HRSEM (High Resolution Scanning Electron Microscopy) TEM (transmission electron microscopy)
- Density (helium pycnometry) and porosity (nitrogen adsorption desorption – NAD)
- Thermogravimetric Analysis (TGA)
- Zeta Potential measurement (electrophoresis and acoustophoresis)
Although many of the above methods of measurement are thought to be standard certain precautions have to be taken when dealing with high surface area nanosized powders. When meeting people from different laboratories around the world we have noticed that many seemingly simple measurements can lead to drastically different results. More often than not, this is due to sample preparation, basic input data and the choice of model for representing the final results. This can be directly related to the lack of detailed and standardised protocols that have to be strictly followed to allow accurate and meaningful comparison and characterisation. For these complimetary techniques such protocols will also be developed with particular emphasis on sample preparation before analysis, the choice of model, and the number of repetitions for statistically significant results – both with respect to sampling and analysis. The recommended procedures will allow quantitative comparison between groups from universities, research institutes and industry alike.