Toolkit
OpenNanopore is a set of python tools for analysis of nanopore current traces. These tools are mainly written for use in Jupyter notebook. Seperately, a GUI (Graphical user Interface) is written that allows easy access to some of the more basic functions of the tools. All the code is accessible via the LBEN git, hosted on c4science.ch :
Access Git (code for GUI included) here.
Analysis UI
The GUI is written using the PyQT library and uses the matplotlib library for plotting. The GUI analysis scripts consist of two python scripts (AnalysisUI.py and EventDetectorUI.py).
Event detection
The event detection script can load currentTraces files from Chimera and Axopatches. The algorithm detects events by using a low pass filter on the trace and detecting events that start with a S deviation from the baseline and end at E from the baseline. The events are corrected by passing them through the CUSUM algorithm for fine tuning of the beginning and end times.
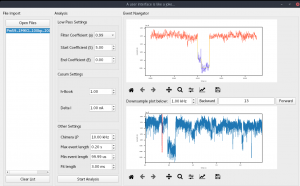
After detection, the event is plotted on top, and its position in the main trace on the bottom.
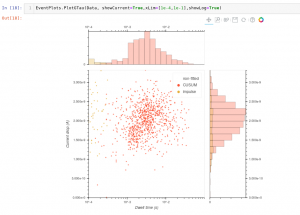
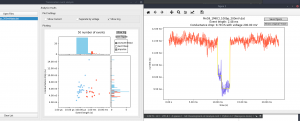
Event summary
The analysis script loads all the events and generates a Conductance drop vs event time plot. Individual events can be selected from the plot, they will be plotted in a separate window.
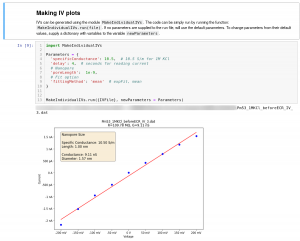
Jupyter Notebook
Jupyter Notebook is a document or notebook that contains live code and text/experimental descriptions. As such it is a useful tool for experimental analysis. Since all the code used to generate the images and post-process the data is stored in the notebook.
An example notebook can be found here.
The toolbox contains typical elements to analyse current traces, like extract an IV curve from the data and calculate pore size based on the equation.
Furthermore, the same event detection and plotting functions can be used as previously described. The parameters in this case are supplied by providing a dictionary with the names of the parameters (for more details see the example notebook file).