In the following text we will introduce different parameters and methods on how to assess indoor climate. Additionally, we put together pros and cons of these specific methods. We mainly focused on the indoor air temperature, relative humidity, the impact of particulate matter and indoor airflow.
Temperature
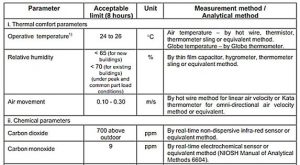
Indoor temperature is an important factor in indoor climate and comfort due to its influence on energy consumption, comfort, sick building syndrome symptoms and overall productivity. Research shows that maximum productivity is achieved around 22 °C. For example, at the temperature of 30 °C the performance is only 91.1% of the maximum [1].
Measurements should be taken periodically and in different locations to make sure that the temperature is consistent. Some tools used to take such measurements are IAQ monitors, thermohygrometers or multi-parameter ventilation meters [2].
One other essential measurement to make is radiant temperature, which is measured with a device called a Black Globe Thermometer. This measurement, along with the measurement of ambient air and wet-bulb temperatures, may be used to calculate the Wet-Bulb Globe Temperature (WBGT) index. This index combines the effects of temperature, humidity, radiant heat, and wind employed to express environmental heat stress [3].
Finally, indoor temperatures can be “guessed” rather than measured if the study is leaning towards an adaptive model, based on the physiology and state of mind of the occupants.
These procedures are based on surveys rather than tools.
We can denote four types of temperature sensors – resistance temperature detectors (RTDs), thermocouples, thermistors and integrated circuit (IC) sensors. Each has its pros and cons, for example, RTD’s measure an “almost linear” curve along T and has to be corrected, thermistors cannot measure wide ranges of temperature due to the flattening of the curve along the T axis. Thermocouples have a low sensitivity and a non-linear curve along T that has to be corrected too [4].
Relative Humidity
Relative humidity plays a crucial role for human comfort in indoor climate. It is indicated in percent of a certain amount of air. The range of relative humidity in which humans can feel comfortable varies widely between 30-70% [5] and is highly dependent on the temperature. But ideally, the relative humidity should be kept in a rather narrow range of 50-60% [6].
To keep relative humidity in this narrow range, it has to be measured. This can be done with different types of so called hygrometers.
An older model of a hygrometer is a Hair Tension Hygrometer. In these devices a human or animal hair is exposed to some tension. Because of the hygroscopy of hairs (hygroscopy: ability to expand with increasing humidity), the gauge of the hygrometer indicates the value of relative humidity. [7]
Another method is to use a so called psychrometer [8]. These tools consists of two thermometers where one is exposed to dry air whereas around the other a moist sock is wrapped. Therefore, one thermometer measures the dry-bulb temperature and the other the wet-bulb temperature. With the difference of these temperatures, the relative humidity can be determined.
The most precise way to measure relative humidity is to use a Chilled Mirror Dew Point Hygrometer [7]. In this device a mirror is cooled down until the surrounding air reaches its vapour saturation. A light source and a photosensor determine the moment of condensation. With the knowledge of the exact dew point temperature, the humidity ratio can be determined. After some calculation, the value of relative humidity can also be obtained.
Airborne Particles and Gases
Another parameter to assess indoor climate are atmospheric aerosol particles and gases. The fact that the ‘Global Burden of Disease’ mentioned the exposure to fine particles with a diameter of 2.5 μm or less, (PM2.5), among the top ten risks leading to lower life expectancy worldwide underlines the importance to measure and control their occurrence.[9]
Another serious and more instant health hazard is carbon monoxide which can originate from uncomplete combustion reactions. CO as well as CO2 are measured in ppm, ‘parts per million’. After the WHO, the level of CO should never exceed 10 ppm per 8 hours ] to 90 ppm per 15 minutes. [10]
In contrast, the amount of CO2 in the indoor air should not be higher than 700ppm relative to the outdoor air as to prevent an impairment on performance[11].
Instruments to measure the levels of PM2.5 are for example nephelometers or Beta attenuation mass monitoring devices, while the first one is cheap enough to be used commonly, the latter one can be considered for professionals[12]. CO and CO2 are now a day often measured with Nondispersive infrared (NDIR) sensors. Their advantage is, that they are highly selective to the measured gas. A cheaper alternative represents a metal oxide (MOx) sensor, which is a chemical sensor[13].
Ventilation
As already mentionned it is also possible to collect information through surveys to tackle the problem with a holistic approach. Althought this method gives a interessting subjective point of view of the situation it should be precised that it could be highly influenced by many factors.
In an indoor environment, it is crucial to maintain the air flow in an acceptable range given in ASHRAE 62.1 or ISO 17772 as the rate of air flow has a direct impact on the previously discussed parameters. To do so there are many methods to assess the air flow [14].
For instance, we can use tools such as anemometer or a balancing hood that measure air flow and air pressure. The advantage of these tools is that there could be used by consultant for a quick analysis in situ.
There are other interesting monitoring methods that are more expensive such as ducted air flow measurements [15]. They have the advantage of being permanent and more precise and the disadvantage to be non-mobile and more expensive. For further information check ISO 3966:2020.
Another interesting way to assess is to use tracer gases such as CO2 or SF4 that are colorless and odorless. By using a tool to measure the concentration of the gases we can determine interesting data. This method presents a problem which is the fact that both of the aforementioned gases are green house gases [14].
The accumulation of data through controls may contributes to improve the modeling of indoor environments and also makes possible to tackle the problem with a statistical approach.
Conclusion
In conclusion, these four parameters are revelant to assess indoor climate. Nonetheless we could consider other aspects not included in the indoor climate standards such as occupancy levels, acoustics or lighting. Meanwhile these parameters may rule indoor environment, it is important to denote that outdoor weather conditions have a substantial influence over indoor climate and that it cannot be controlled.
Bibliography
- Olli Seppänen, William J Fisk, Quanhong Lei-Gomez (2006) Room temperature and productivity in office work – Healthy Buildings Conference
- Indoor Air Quality Handbook: A Practical Guide to Indoor Air Quality Investigations – TSI Incorporated https://www.instrumart.com/assets/TSIAlnor_IAQ_handbook.pdf
- https://www.campbellsci.com/blackglobe
- What are You Sensing? Pros and Cons of Four Temperature Sensor Types – November 25, 2015 in Sensors – Manny Soltero https://www.mouser.com/blog/what-are-you-sensing-pros-and-cons-of-four-temperature-sensor-types
- C. Gilmore (1972): More Comfort for Your Heating Dollar (p.99)
- https://en.wikipedia.org/wiki/Relative_humidity, [retrieved the 19.11.2020]
- https://en.wikipedia.org/wiki/Hygrometer (retrieved the 19.11.2020)
- C. Gorse, D. Johnson, M. Pritchard (2012): A Dictionary of Construction, Surveying and Civil Engineering
- GBD 2013 Risk Factors Collaborators et al, “Global, regional, and national comparative risk assessment of 79 behavioural, environmental and occupational, and metabolic risks or clusters of risks in 188 countries, 1990–2013: a systematic analysis for the Global Burden of Disease Study 2013”, The Lancet vol.386, published the 05.11.2015, [retrieved the 28.10.2020]
- ASHRAE, ”ASHRAE Addendum ad to ASHRAE Standard 62-2001”, published the 30.01.2003, [retrieved the 28.10.2020]
- Meyer Robinson, “The Human Brain Evolved when carbon dioxide was lower”, The Atlantic, www.theatlantic.com/science, published the 20.12.2019, [retrieved the 26.10.2020]
- Johnson Christine, “How Does the Laser Egg Measure PM2.5”, Kaiterra, learn.kaiterra.com, published the 02.05.2019, [retrieved the 26.10.2020]
- Stassen Ivo et al, “Chemiresistive Sensing of Ambient CO2 by an Autogenously Hydrated Cu3(hexaiminobenzene)2 Framework”, ACS Publications, pubs.acs.org, published the 27.06.2019, [retrieved the 26.10.2020]
- Jennifer McWilliams (2002). Review of Airflow Measurement Techniques
- Craig P Wray, Iain S Walker, Max H Sherman (2002). Accuracy of flow hoods in residential applications