Contact: Maaz Mashood Mohiuddin
We consider the novel framework for real-time control of the power grids called Commelec [1], which is envisioned to be deployed at the EPFL Smart-Grid in the near future.
In this framework, each part of the grid is assigned to a software agent (“grid agent”) whose goal is to optimize the performance and the quality of service of the grid by continuously controlling the devices under its responsibility.
In order to do so, the agent receives messages from the resources, called advertisements, which contain information about their capabilities, expected behavior, and a simplified view of their internal state, represented as mathematical objects, like real functions (cost functions) and 2D sets.
The advertisement messages are sent to the grid agent using a modern, cross-language data serialization tool/library called Cap’n Proto (http://kentonv.github.io/capnproto/).
This tool introduces a schema language, in which we have written the entire specification of the Commelec messages.
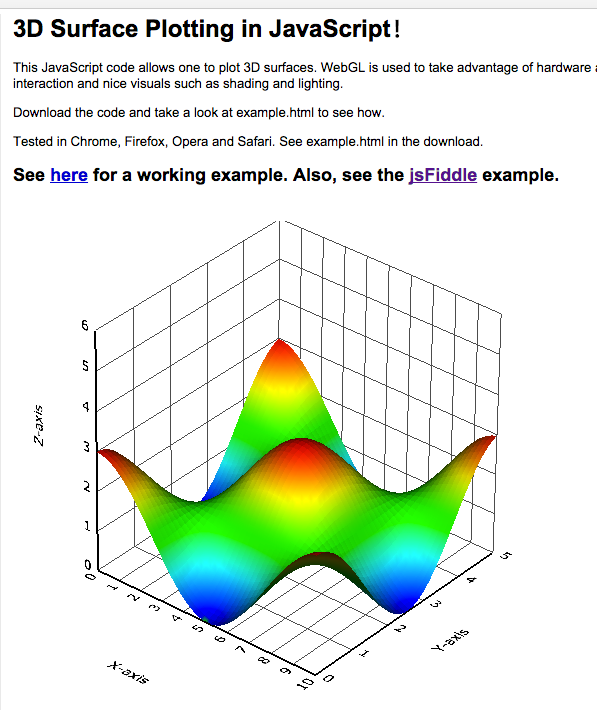
An important aspect of the Commelec project is that researchers from other disciplines, like people from Building Energy Management, or Power Electronics engineers, will design and build resources, that need to send advertisements (in the format as defined by us) to the grid agent. To make their life easier (and to guide them, and notify them in case they make mistakes), we want to design a web-based tool, with which people can: (i) specify mathematical formulas that will be displayed to the user in rendered form as well as parsed into our message format, and (ii) graphically design complex set-structures, like the set-intersection of a disk with the set-union of a triangle and a polygon, where for example the radius of the circle should be “exported” as a variable.
Your goal in this project would be to design this GUI environment that will allow for:
1. Visual creation of the advertisement messages. The above advertisement elements will be created by “drag-and-drop” style;
2. Text-based entry of the advertisement structure (in a language that you design), with live visual feedback of the structures and functions that the user describes.
The created message will be in the Cap’n Proto format, ready to be used in the framework.
3. Visualization of the advertisement messages (given in the Cap’n Proto format) “on-the-fly”, while they are sent to the grid agent.
This is similar to the “wire inspection” tools such as Wireshark for communication networks.
The environment is required to be platform-independent, and preferably work from a web-browser.
To implement this environment, you will use Scalable Vector Graphics (SVG) format and will explore different available tools such:
– Math input and parsing tools. E.g., MathLex: http://mathlex.org/, http://mathlex.org/demo
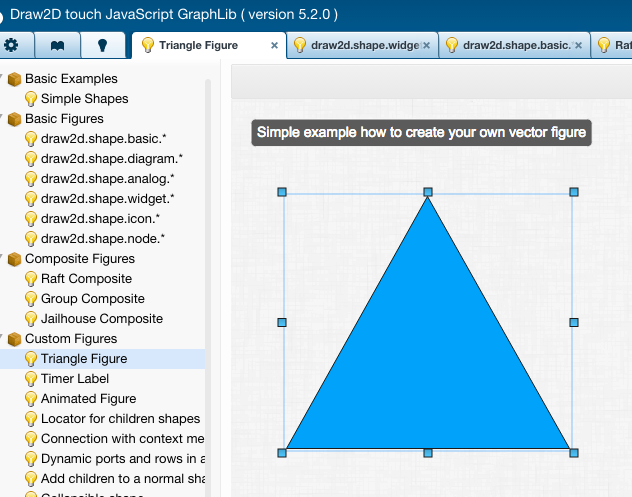
– Visual diagram creation tools. E.g., Draw2D: http://www.draw2d.org/draw2d/,http://draw2d.org/draw2d_touch/jsdoc_5/#!/example

Required skills / Learning opportunities:
Strong programming skills, javascript, python, parsing technology
References: