This study [1] involves the participation of five independent laboratories in order to examine the alternative of applying a surface reconstruction algorithm to render point clouds. For this purpose, a representative set of geometry-only point clouds is assembled and degraded using Octree-pruning. The screened Poisson surface reconstruction algorithm [2] is used to convert point clouds to meshes for display.
In this webpage, we make publicly available a dataset consisting of reference point clouds, degraded point cloud and mesh stimuli, degradation levels, and subjective quality scores that were obtained from the participating laboratories. Moreover, results from inter-laboratory comparisons, benchmarking of objective quality metrics, and correlation between two types of point cloud visualization approaches are provided [1].
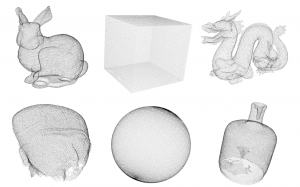
Reference models of the dataset represented as point clouds
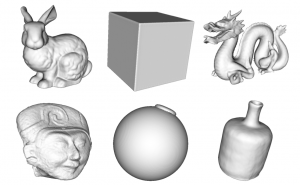
Reference models of the dataset represented as meshes
Contents
Bunny and dragon are selected from the Stanford 3D Scanning Repository to represent point cloud contents with regular geometry and reduced amount of noise. Cube and sphere are artificially generated using mathematical formulas and represent synthetic contents with highly regular geometry. Egyptian_mask is selected from the MPEG PCC Dataset, and vase is manually captured using the Intel RealSense R200 camera, constituting of representative point clouds with irregular structure that can be acquired by low-cost depth sensors. The contents are scaled to fit in a bounding box of size 1.
Types of degradation
Octree-pruning is used to simulate compression distortions. It is obtained by setting a desirable Level of Detail (LoD) in the octree structure that encloses the content. The LoD is set appropriately for each content to achieve target percentages of remaining points (ρ), allowing an acceptable deviation of ±2% (ρ = {90%, 70%, 50%, 30%}).
Download
In the provided URL link you can find the dataset.
stimuli
In this folder, you can find the point clouds that are selected and compressed, together with the corresponding meshes that are generated and used in the subjective evaluations of the study [1]. The point cloud and mesh stimuli are stored in PLY and VTK format, respectively, using ASCII encoding. The following naming convention is adopted:
- contentName = {bunny, cube, dragon, egyptian_mask, sphere, vase},
- degradationLevel = {L01, L02, L03, L04}, with increasing numbers indicating higher levels of degradations. For instance, L01 and L04 correspond to 90% and 30% of remaining points, respectively.
The reference contents are noted as: contentName.(xx), while the distorted stimuli are noted as: contentName_degradationLevel.(xx), for both point clouds (xx = ply) and meshes (xx = vtk).
Note that the same stimuli are also used in [3], where the subjective experiments involve 3D display technologies.
subjective scores
In this folder, you can find an .xlsx file with subjective quality scores for the stimuli under evaluation used in the study [1], as obtained from the participating laboratories. Note that ratings for the reference contents are also provided, since they served as hidden references in the subjective experiments.
Moreover, the complete set of results from inter-laboratory comparisons, benchmarking of objective quality metrics, and correlation between two different types of rendering are additionally reported. In particular, in the given .xlsx file you can find:
- The raw subjective scores obtained from every laboratory.
- The complete set of correlation results for every pair combination of laboratories.
- Benchmarking results of state-of-the-art objective quality metrics against ground truth subjective scores from every laboratory.
- Correlation results based on performance indexes between two types of point cloud rendering approaches, namely, raw point clouds [4] against mesh models reconstructed using the Screened Poisson algorithm [1]. The subjective scores for the experiments using raw point clouds are released in the G-PCD dataset.
degradation levels
In this folder, you can find a .csv file with the degradation levels of the stimuli used in the study [1]. The number of input and output points are provided together with the degradation level per stimulus.
Conditions of use
If you wish to use any of the provided material in your research, we kindly ask you to cite [1].
References
- E. Alexiou, M. Bernardo, L. S. Cruz, L. G. Dmitrovic, R. Duarte, E. Dumic, T. Ebrahimi, D. Matkovic, M. Pereira, A. Pinheiro and A. Skodras, “Point Cloud Subjective Evaluation Methodology based on 2D Rendering,” 2018 Tenth International Conference on Quality of Multimedia Experience (QoMEX), Cagliari, 2018, pp. 1-6. doi: 10.1109/QoMEX.2018.8463406
- M. Kazhdan and H. Hoppe, “Screened Poisson Surface Reconstruction,” ACM Trans. Graph., vol. 32, no. 3, pp. 29:1–29:13, July 2013.
- E. Alexiou, A. M. G. Pinheiro, C. Duarte, D. Matković, E. Dumić, L. A. da Silva Cruz, L. G. Dmitrović, M. V. Bernardo, M. Pereira and T. Ebrahimi “Point cloud subjective evaluation methodology based on reconstructed surfaces“, Proc. SPIE 10752, Applications of Digital Image Processing XLI, 107520H (17 September 2018). doi: 10.1117/12.2321518
- E. Alexiou and T. Ebrahimi, “On the performance of metrics to predict quality in point cloud representations,” Proc. SPIE 10396, Applications of Digital Image Processing XL, 103961H (19 September 2017). doi: 10.1117/12.2275142