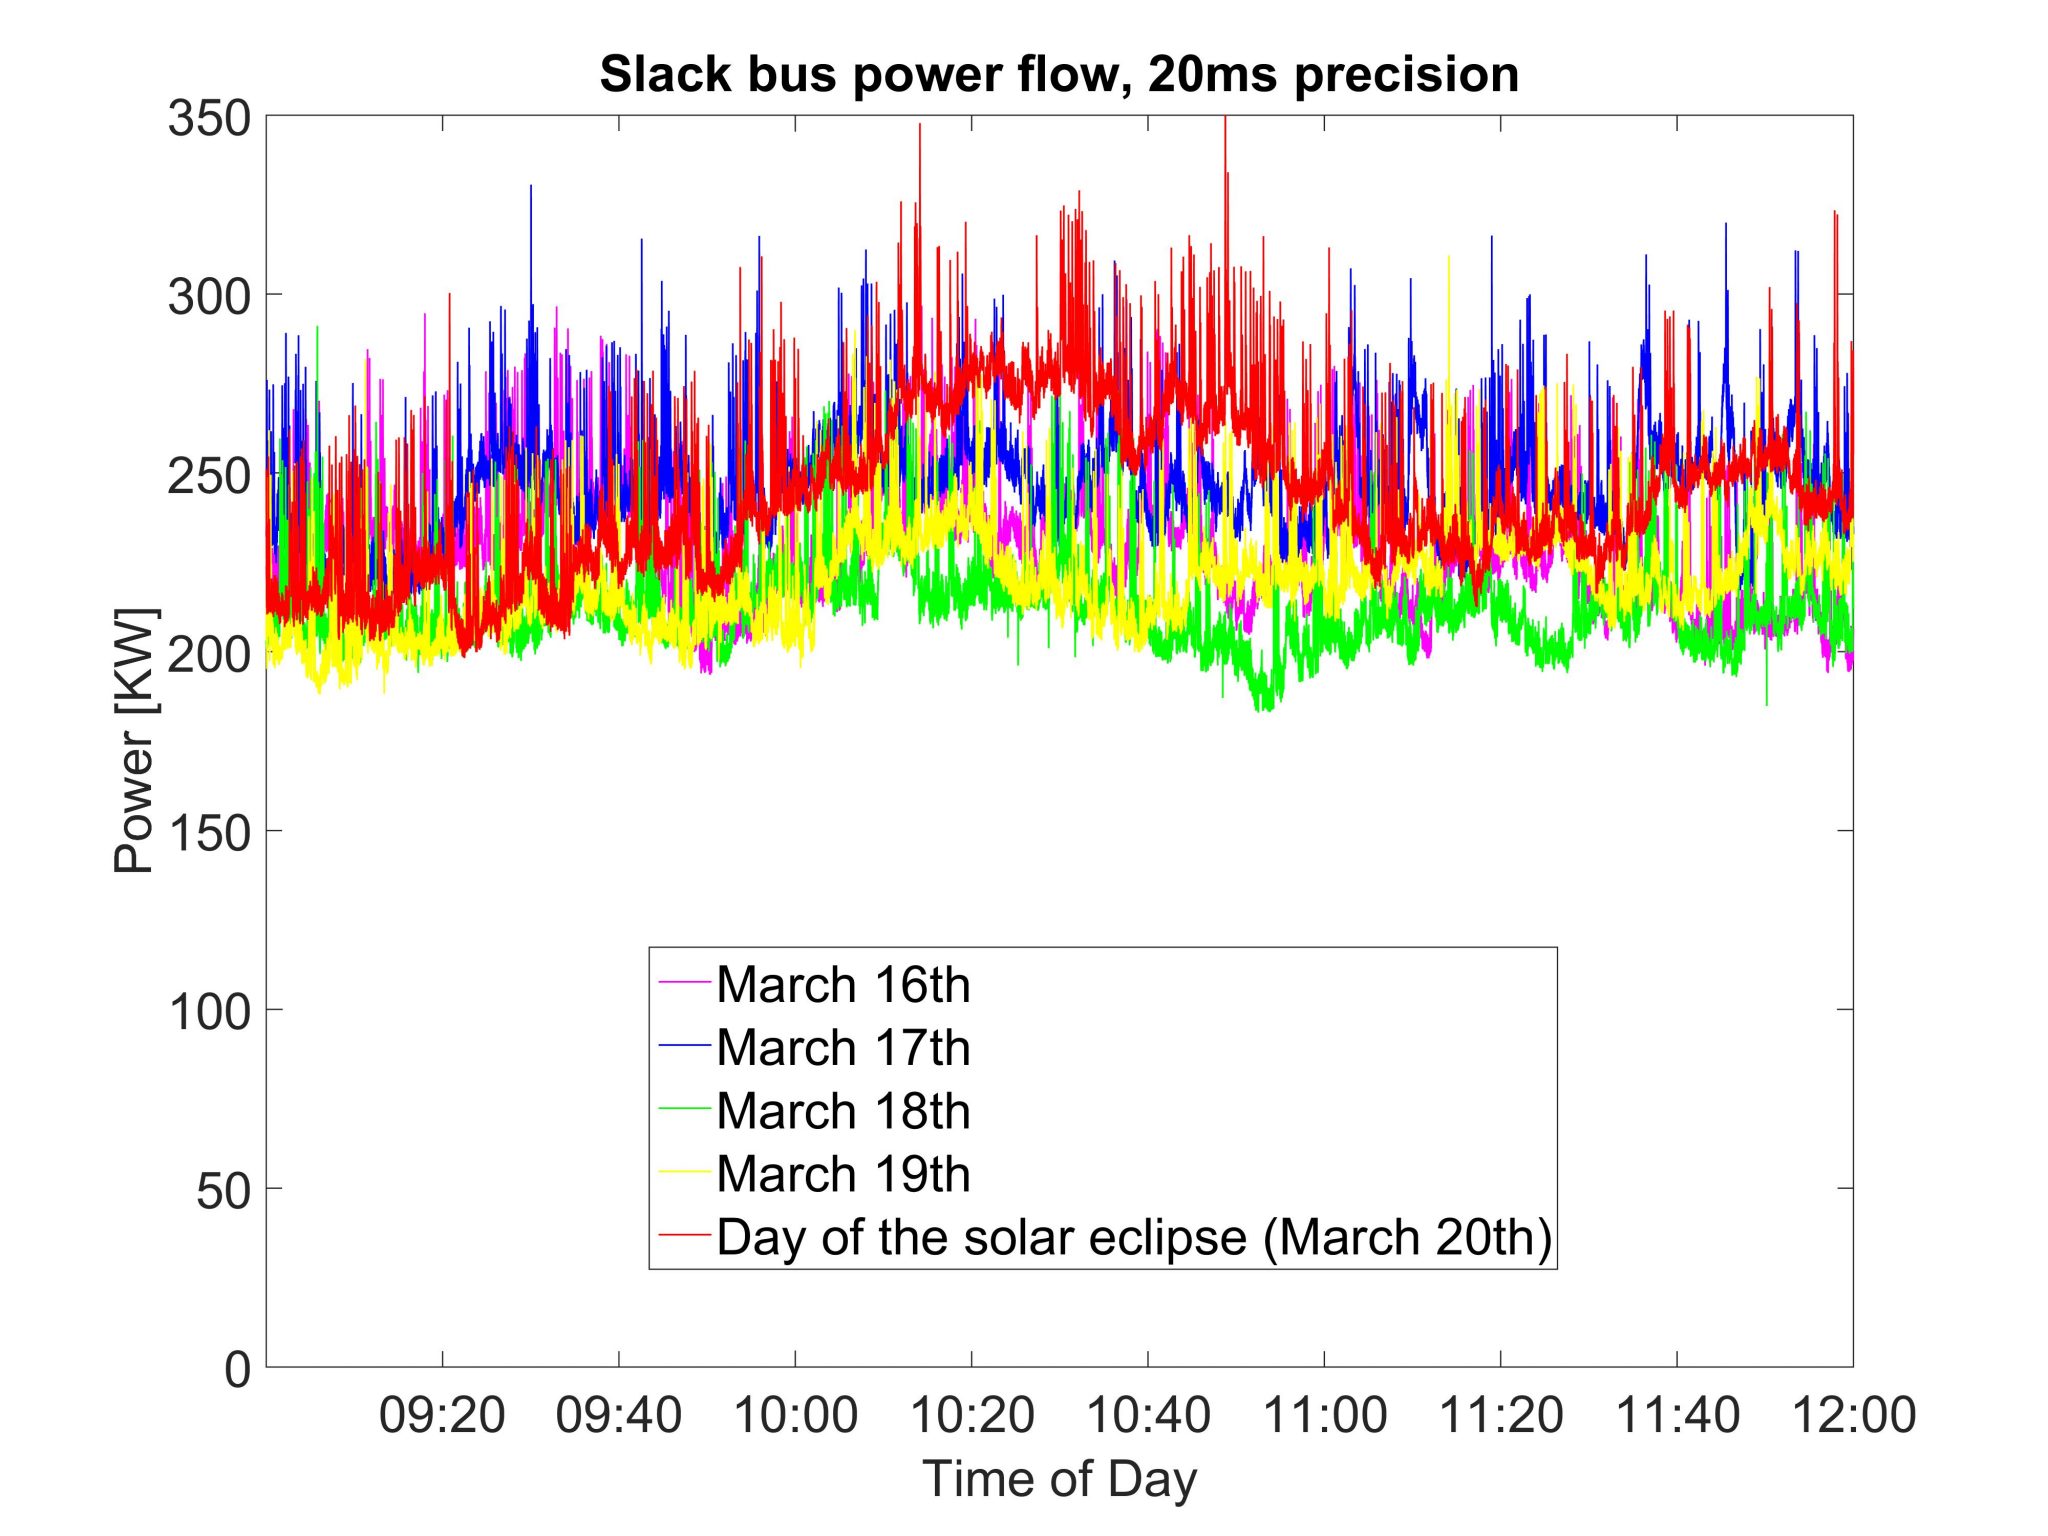
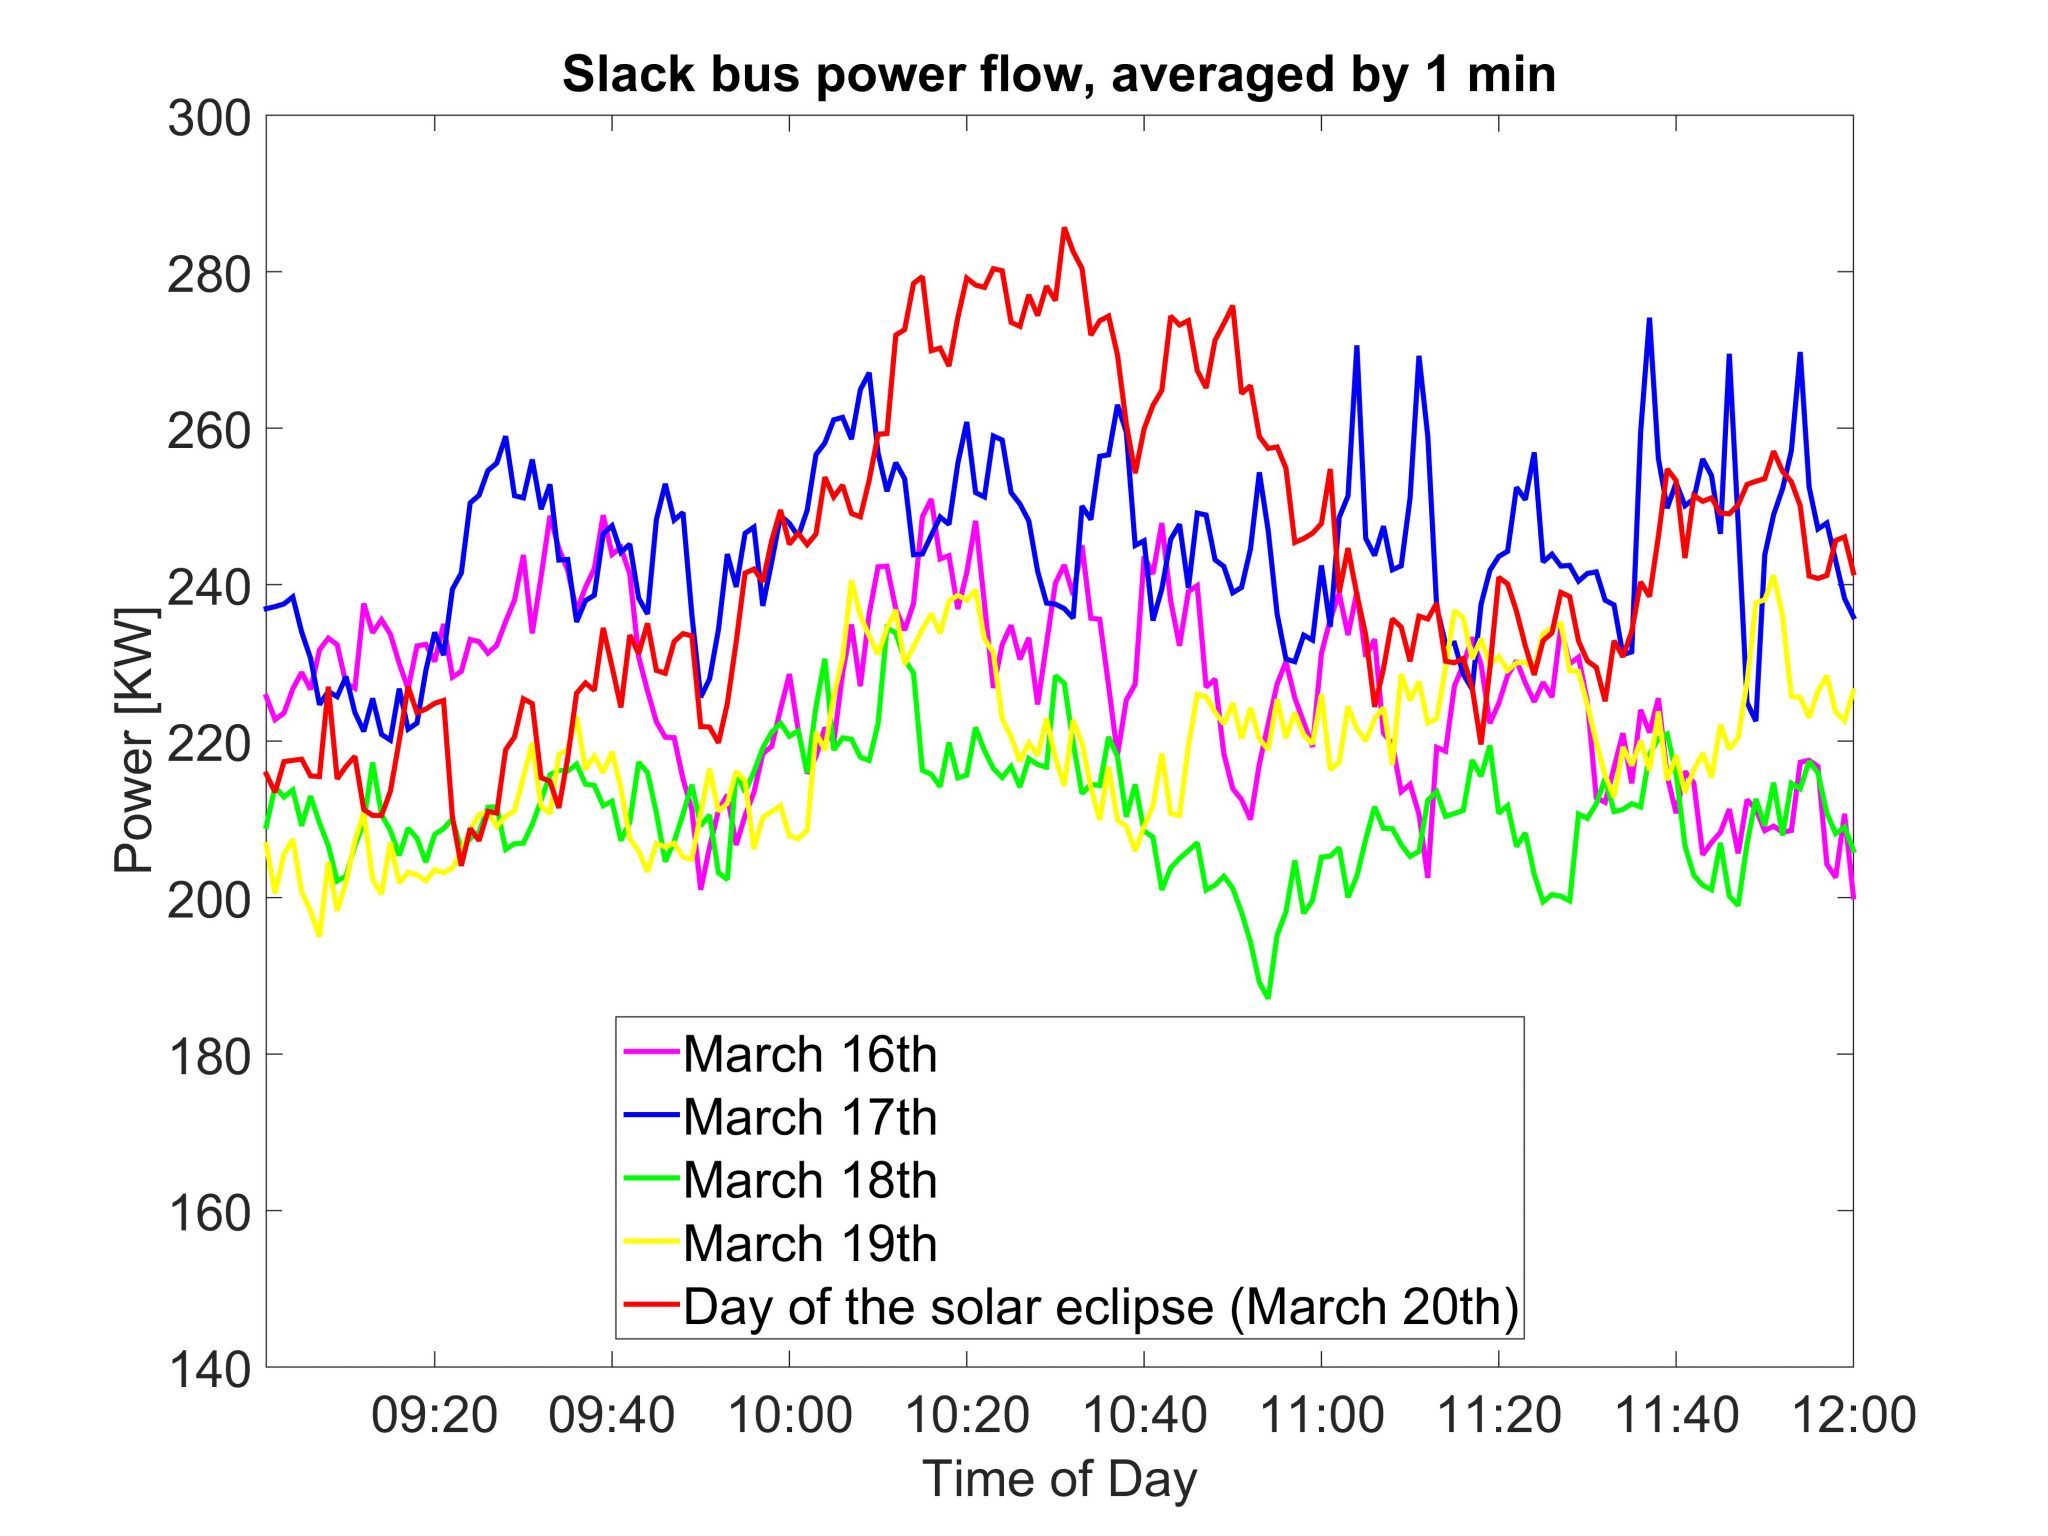
Our real-time monitoring system allows us to compute the net consumption of EPFL buildings, which is equal to the load minus the production of solar panels. During an eclipse, the net consumption increases because the solar panel production decreases. The last solar eclipse in Lausanne occurred on 2015 March 20th between 09:23 and 11:43 with a maximum at 10:31. Below we show a zoom on the power drawn from the grid during the period between 09:00 and 12:00 (180 minutes).
We derive the power flow at the slack bus of the EL feeder from the voltage and current measurements taken by the PMUs every 20ms. . The first graph shows the full resolution of our monitoring system (20ms), the second one shows 1-min averages of the same data. In both cases, the red line represents the day of the eclipse and we can see the “bump” in the middle of the graph that corresponds to the period when the eclipse was around its maximum. We do not observe a similar behavior on the other days.