Project summary
EUROfusion – the European Consortium for the Development of Fusion Energy, has just selected EPFL as the site for its Advanced Computing Hub. This research hub will be led by the Swiss Plasma Center and bring together a diverse group of scientists from EPFL’s Institute of Mathematics, SCITAS (which houses a high-performance scientific computing platform), Swiss Data Science Center (a national center of excellence in big data), and Laboratory for Experimental Museology (eM+). These experts will provide scientific and technical support as well as supercomputing capacity to European researchers working in the field of fusion power.
The purpose of the hub is to provide comprehensive, Europe-wide support for fusion simulations. Incredibly powerful computers are needed to simulate the complex phenomena involved in the fusion process, and these computers must be used wisely and upgraded regularly. “We’ll try to work in a scalable, adaptable manner. EUROfusion researchers need to be able to benefit from future advancements in computing technology. Our job at the Advanced Computing Hub will be to update existing simulation codes so that researchers can take full advantage of new capabilities offered by upcoming generations of supercomputers,” says Gilles Fourestey, head of the hub’s operations.
Real-time visualizations
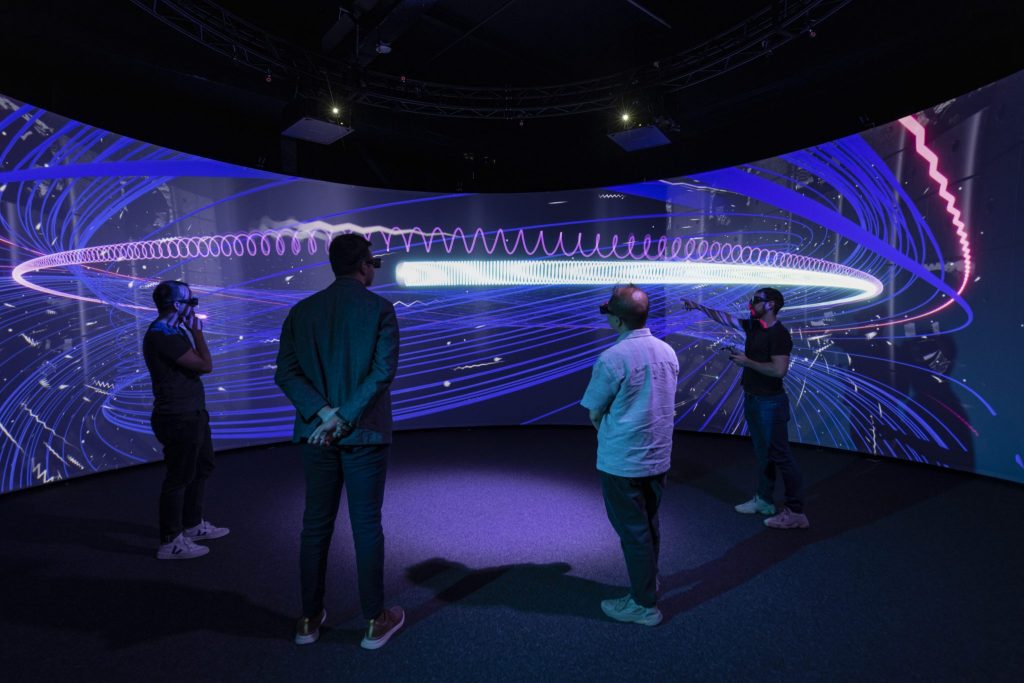
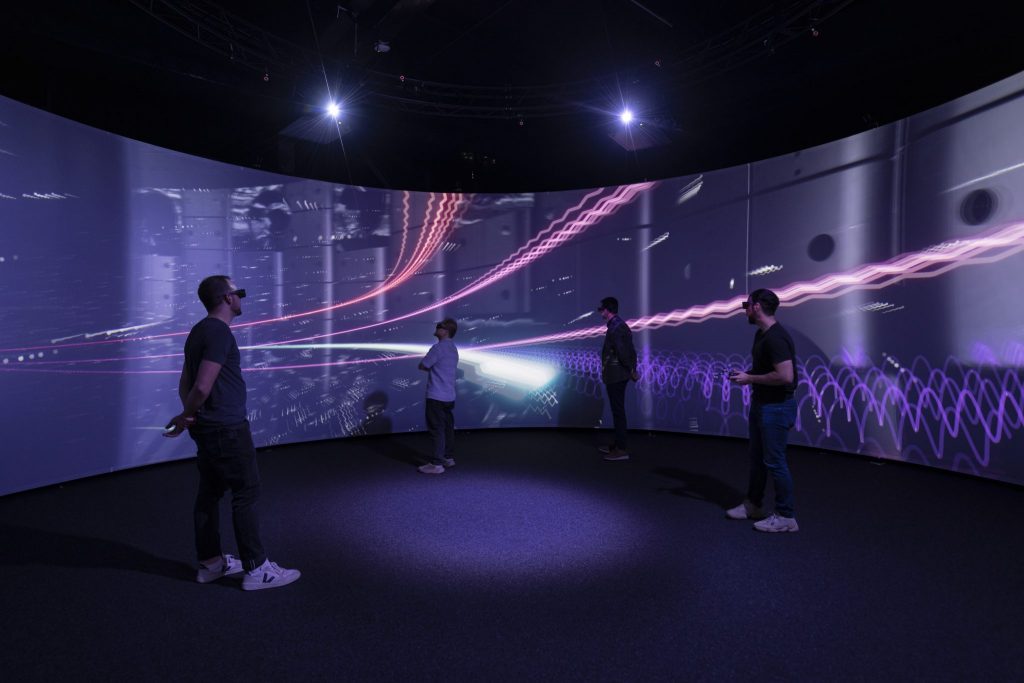
The hub will also draw on one of EPFL’s new areas of expertise: 3D data visualization, using technology developed at the Laboratory for Experimental Museology (eM+), headed by Prof. Sarah Kenderdine. To help the scientists better understand the highly complex data generated by the supercomputers, Kenderdine’s lab will supply immersive augmented reality technology and state-of-the-art facilities for performing highly advanced 3D visualizations.
The goal will be to graphically display the results of simulations and, ultimately, to allow researchers to interact with them in real time. “What we’re going to be doing is taking data feeds live from the Swiss Plasma Center and importing them into these big systems. This allows multiple researchers to come together in a visualization space. The emergence of real-time graphics is a big, booming area, where so much is possible. But how you construct these worlds is not yet clear. So that’s what we’re going to figure out together,” says Kenderdine.
Preliminary results
Video walkthrough
This video showcases the equilibrium state of a nuclear fusion reaction in a real-time engine environment.
During this physics reaction, particles are moving inside a tokamak at very high speed. The goal is to turn them into plasma by making them collide, generating a huge amount of energy.
Physicists from EPFL simulated the behavior of particles, such as proton and electrons. The simulation includes data on the magnetic field inside the tokamak, the poloidal field, the density of the particles and their temperature.
At eM+, we utilize this data in Unreal Engine 5’s real-time particle system, « Niagara ». We convert the data into variables and write shader code (computed on the graphic card) that implements nuclear physics equations, determining the position and velocity of each particle visible on the screen at each frame. The simulation operates at a timescale of less than a millisecond.
Overview of the video content (chronologically):
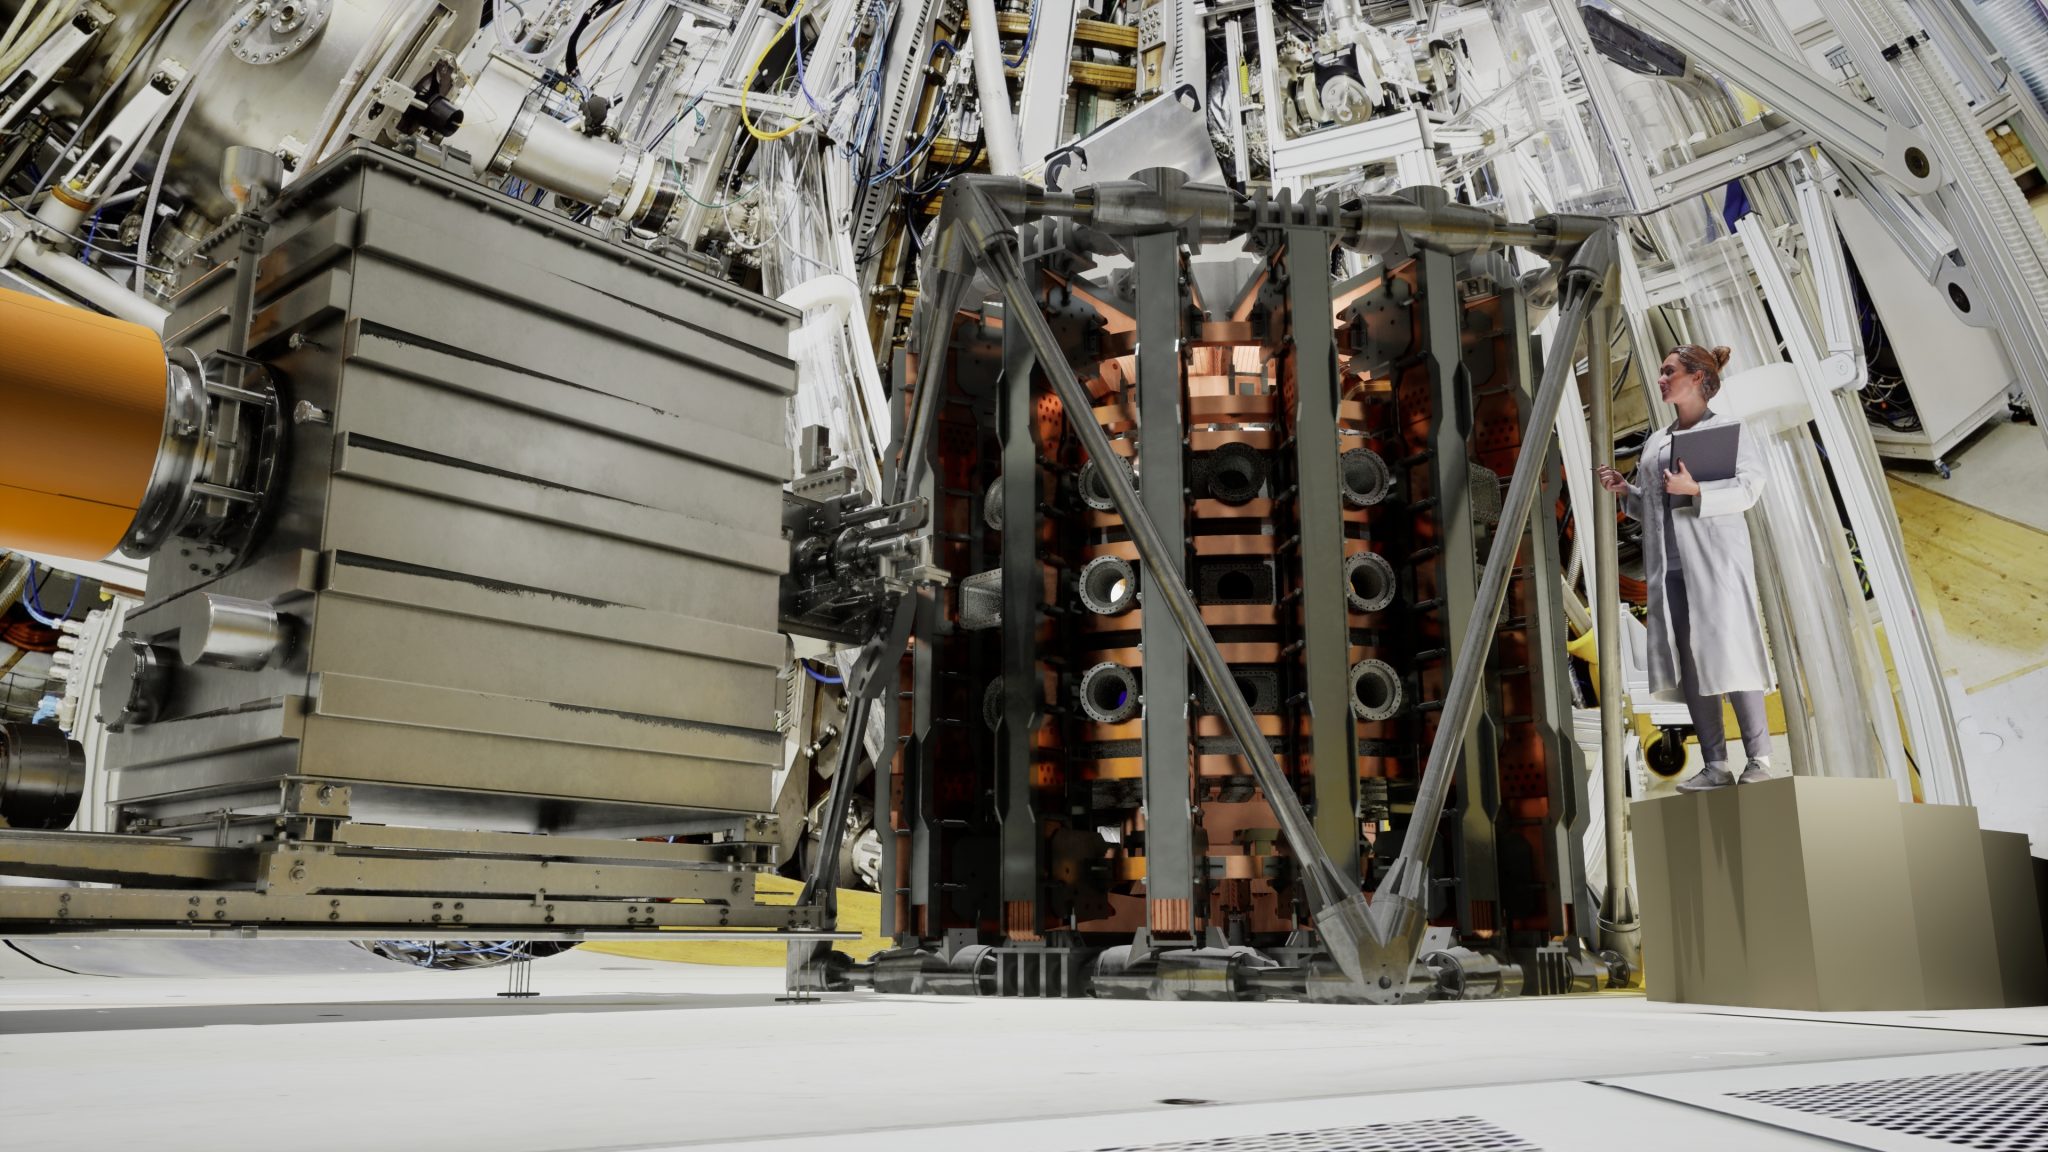
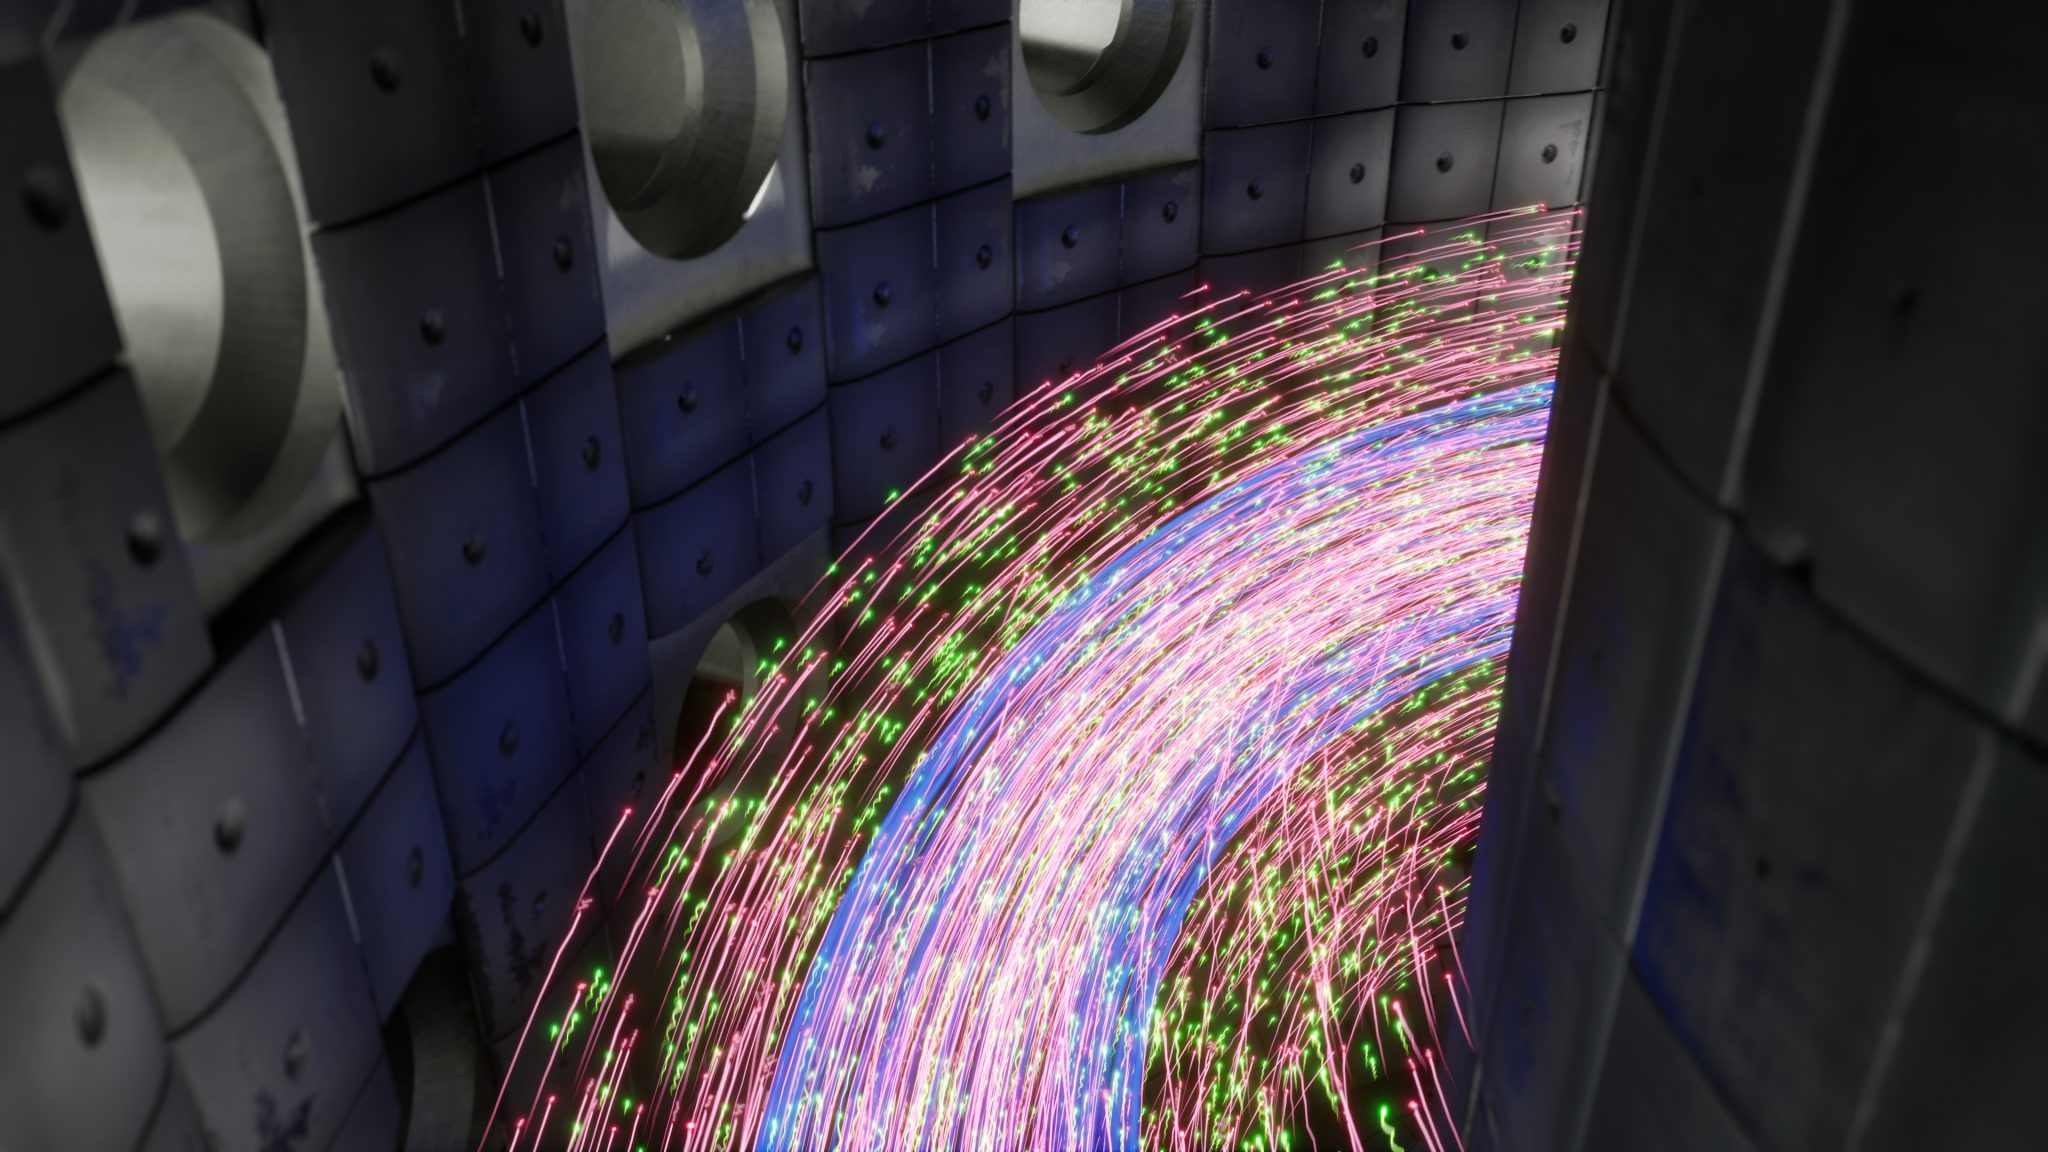
(00:00) The journey begins outside the tokamak, visible in the center with its copper coils. On the left, we see a Neutral Beam Injector, injecting particles inside the tokamak’s chamber. As if we were particles, we enter the tokamak through the NBI.
As we move in, we start to see the flux of particles :
- ion in green, positive charge, shorter trail
- electron in red, negative charge, much lighter than protons so a lot faster and a longer trail.
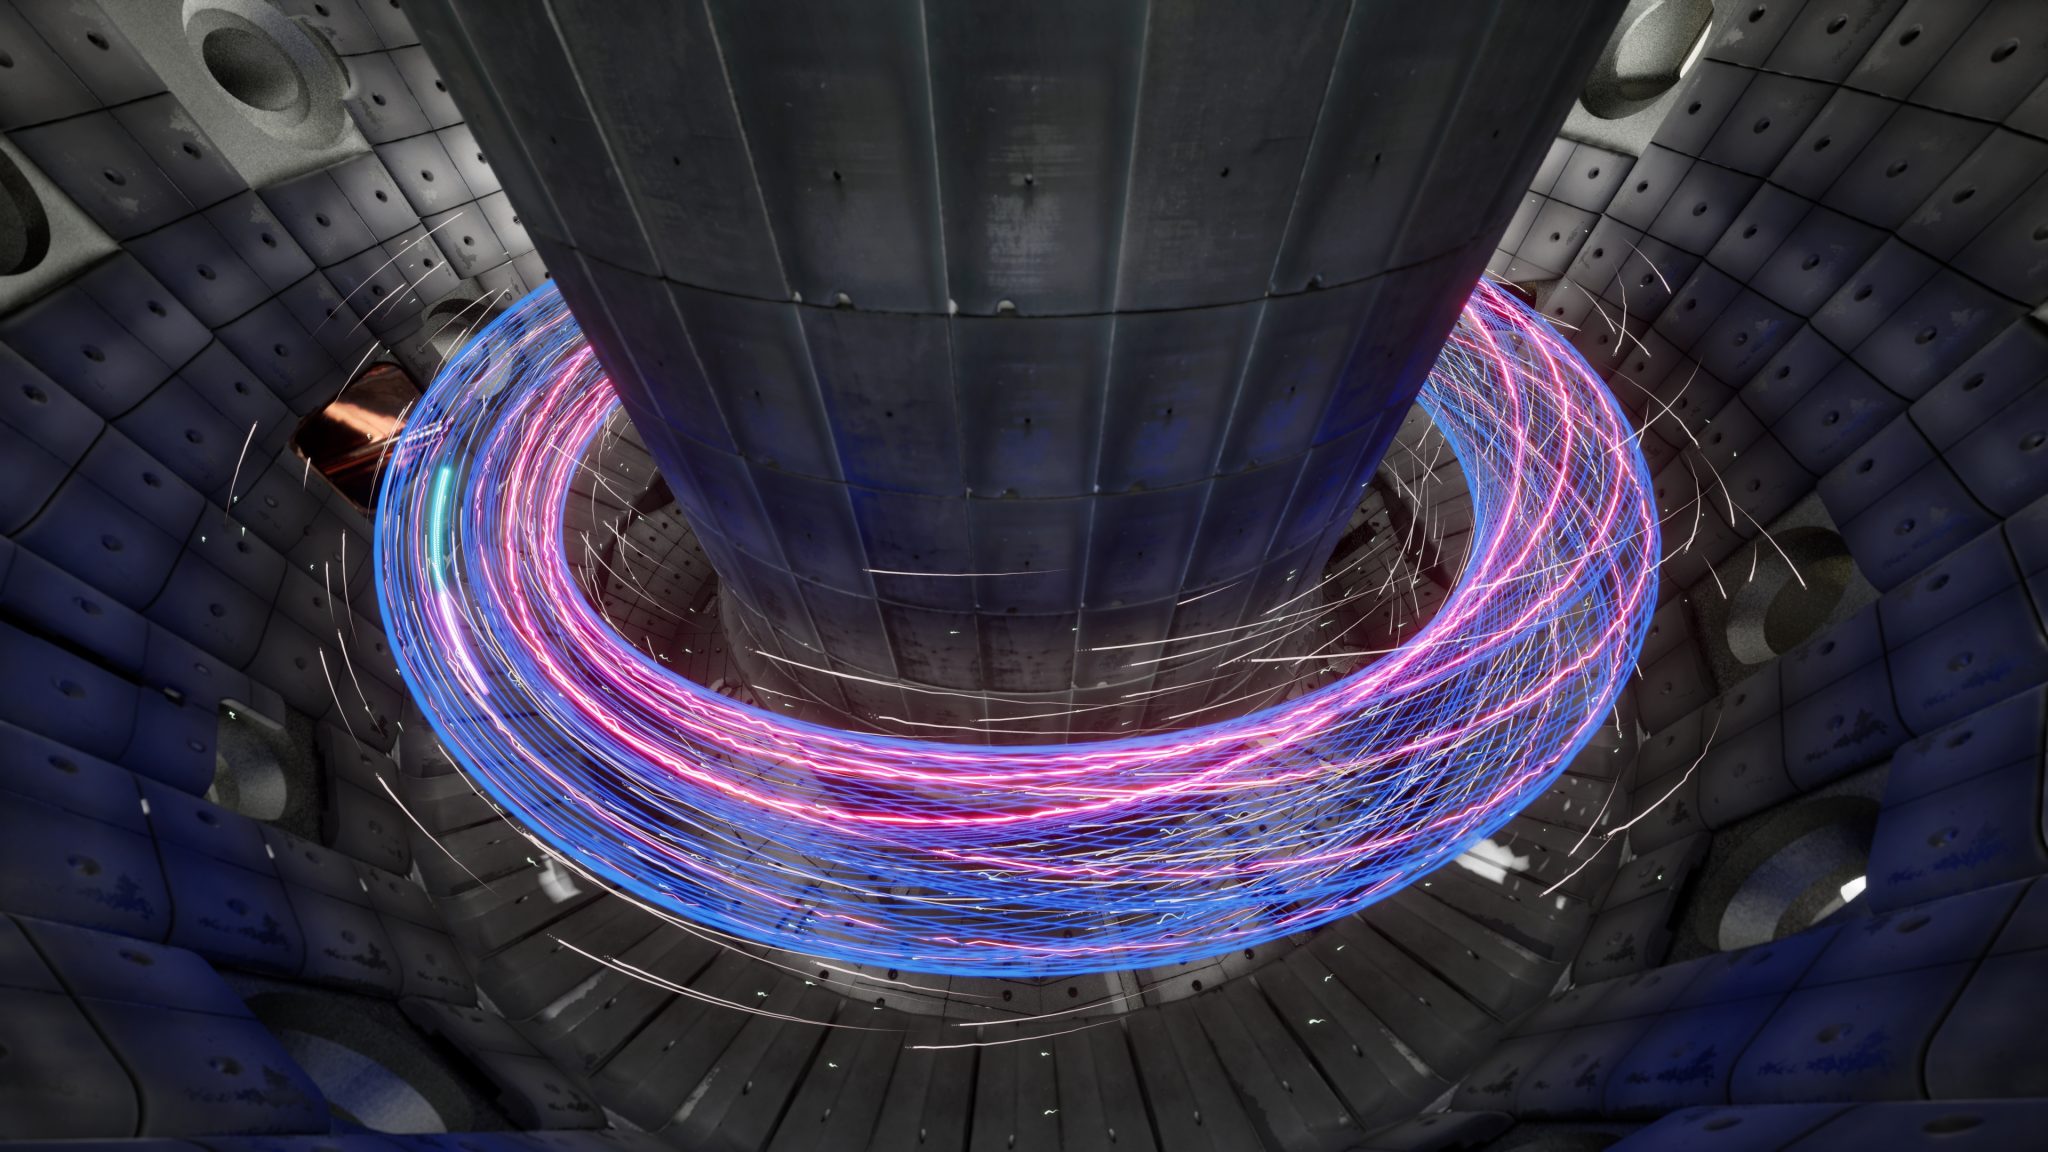
Then, the magnetic field becomes visible in blue, explaining the general path of the particles: they are confined by this field, attempting to bring them closer together.
(00:45) As we navigate along the particles, the video reveals another aspect we’re developing at eM+: photogrammetry captures of the tokamak tiles, alongside fully textured CAD models. This render presents early results compared to the initial schematic 3D model, as we continue refining the workflow and collecting more material from the Swiss Plasma Center.
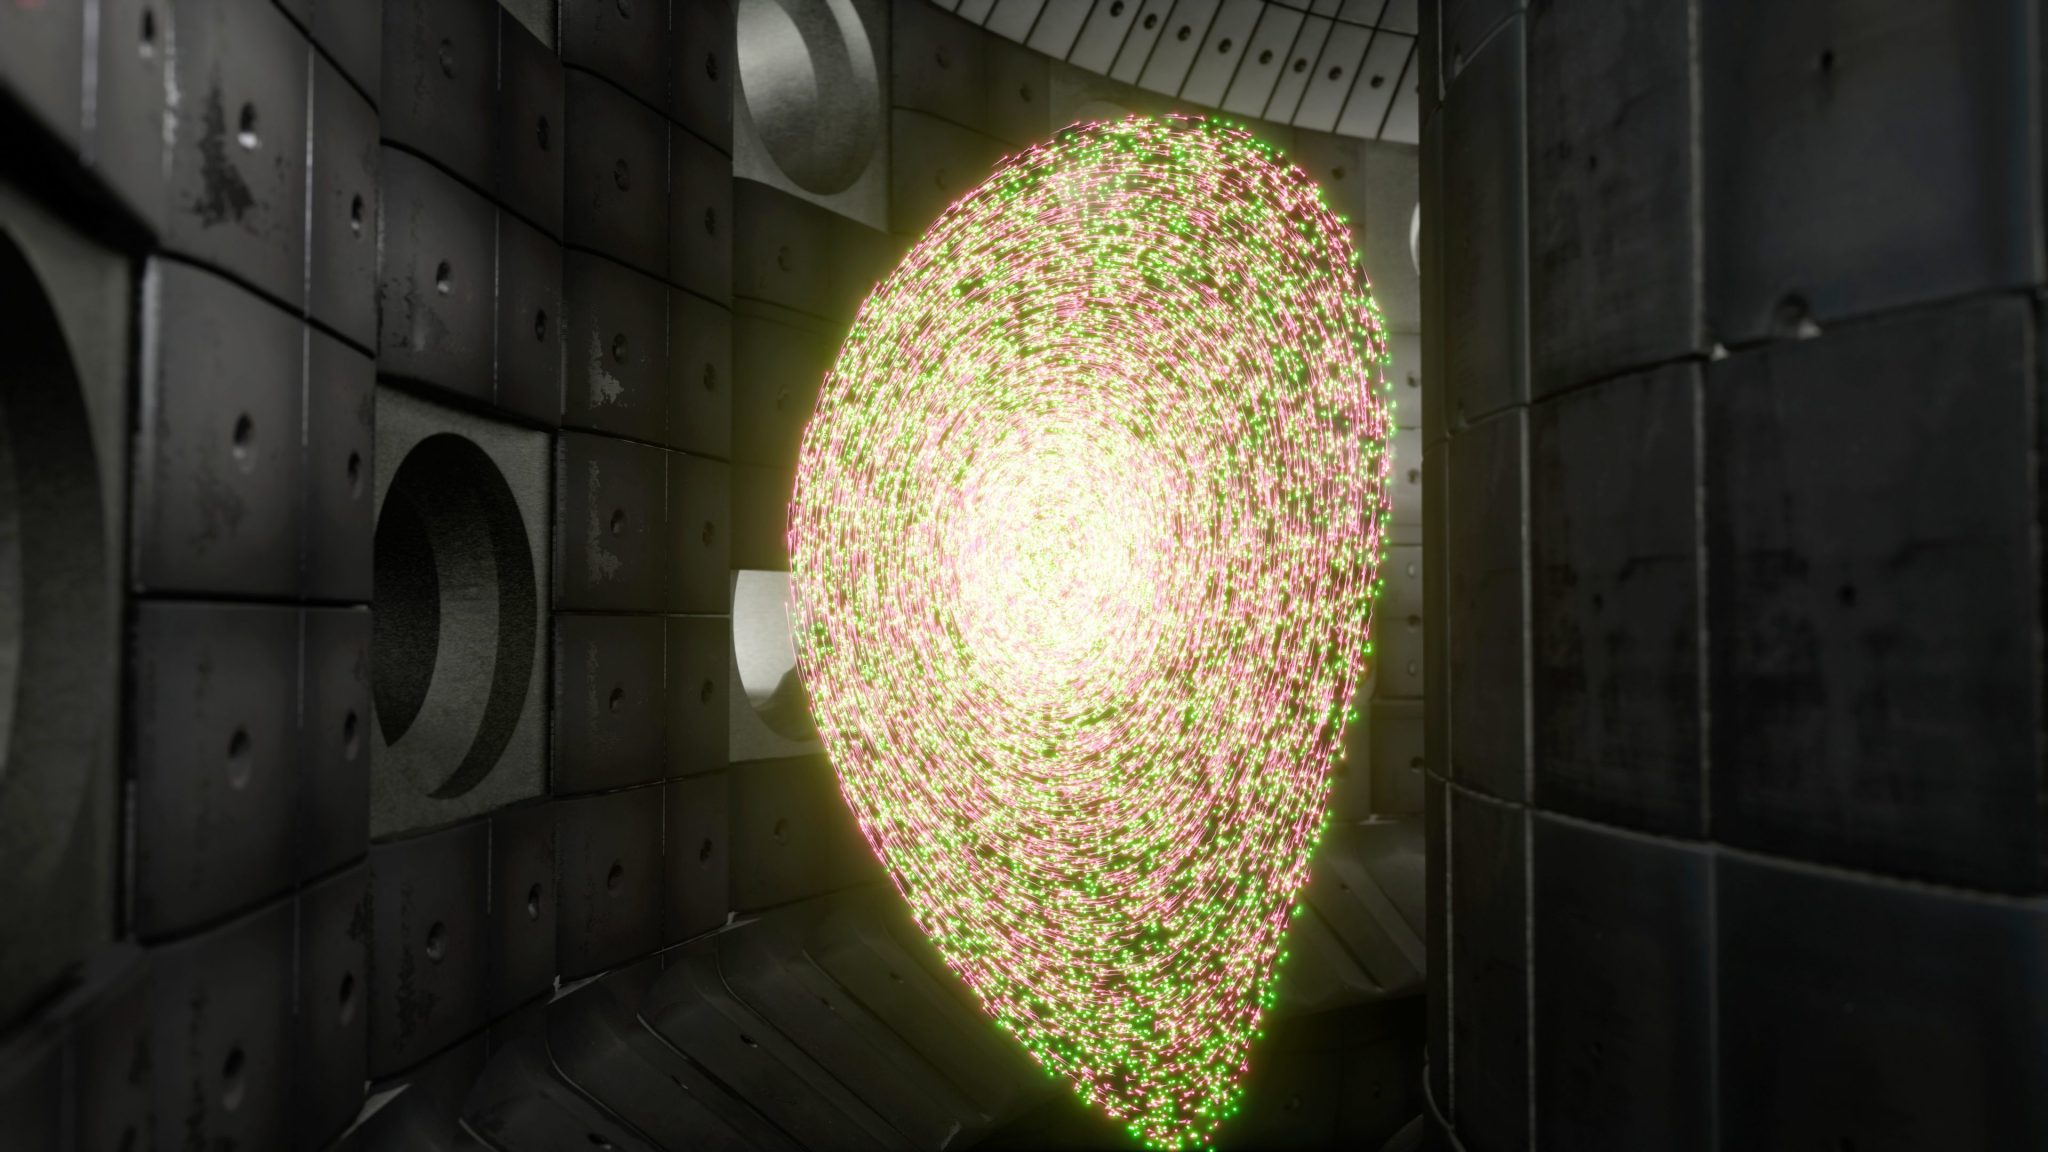
(01:16) Afterward, the particle flux transforms into a ‘slice,’ a flattened visualization. Instead of moving around 360° (a variable phi angle in cylindrical coordinates), the particles are projected onto a 2D plane.
This offers a visually effective method to identify the higher density at the center of the plasma, along with the faster particles. Additionally, it allows observation of particles rotating rapidly around their forward axis and reveals the general shape of the torus.
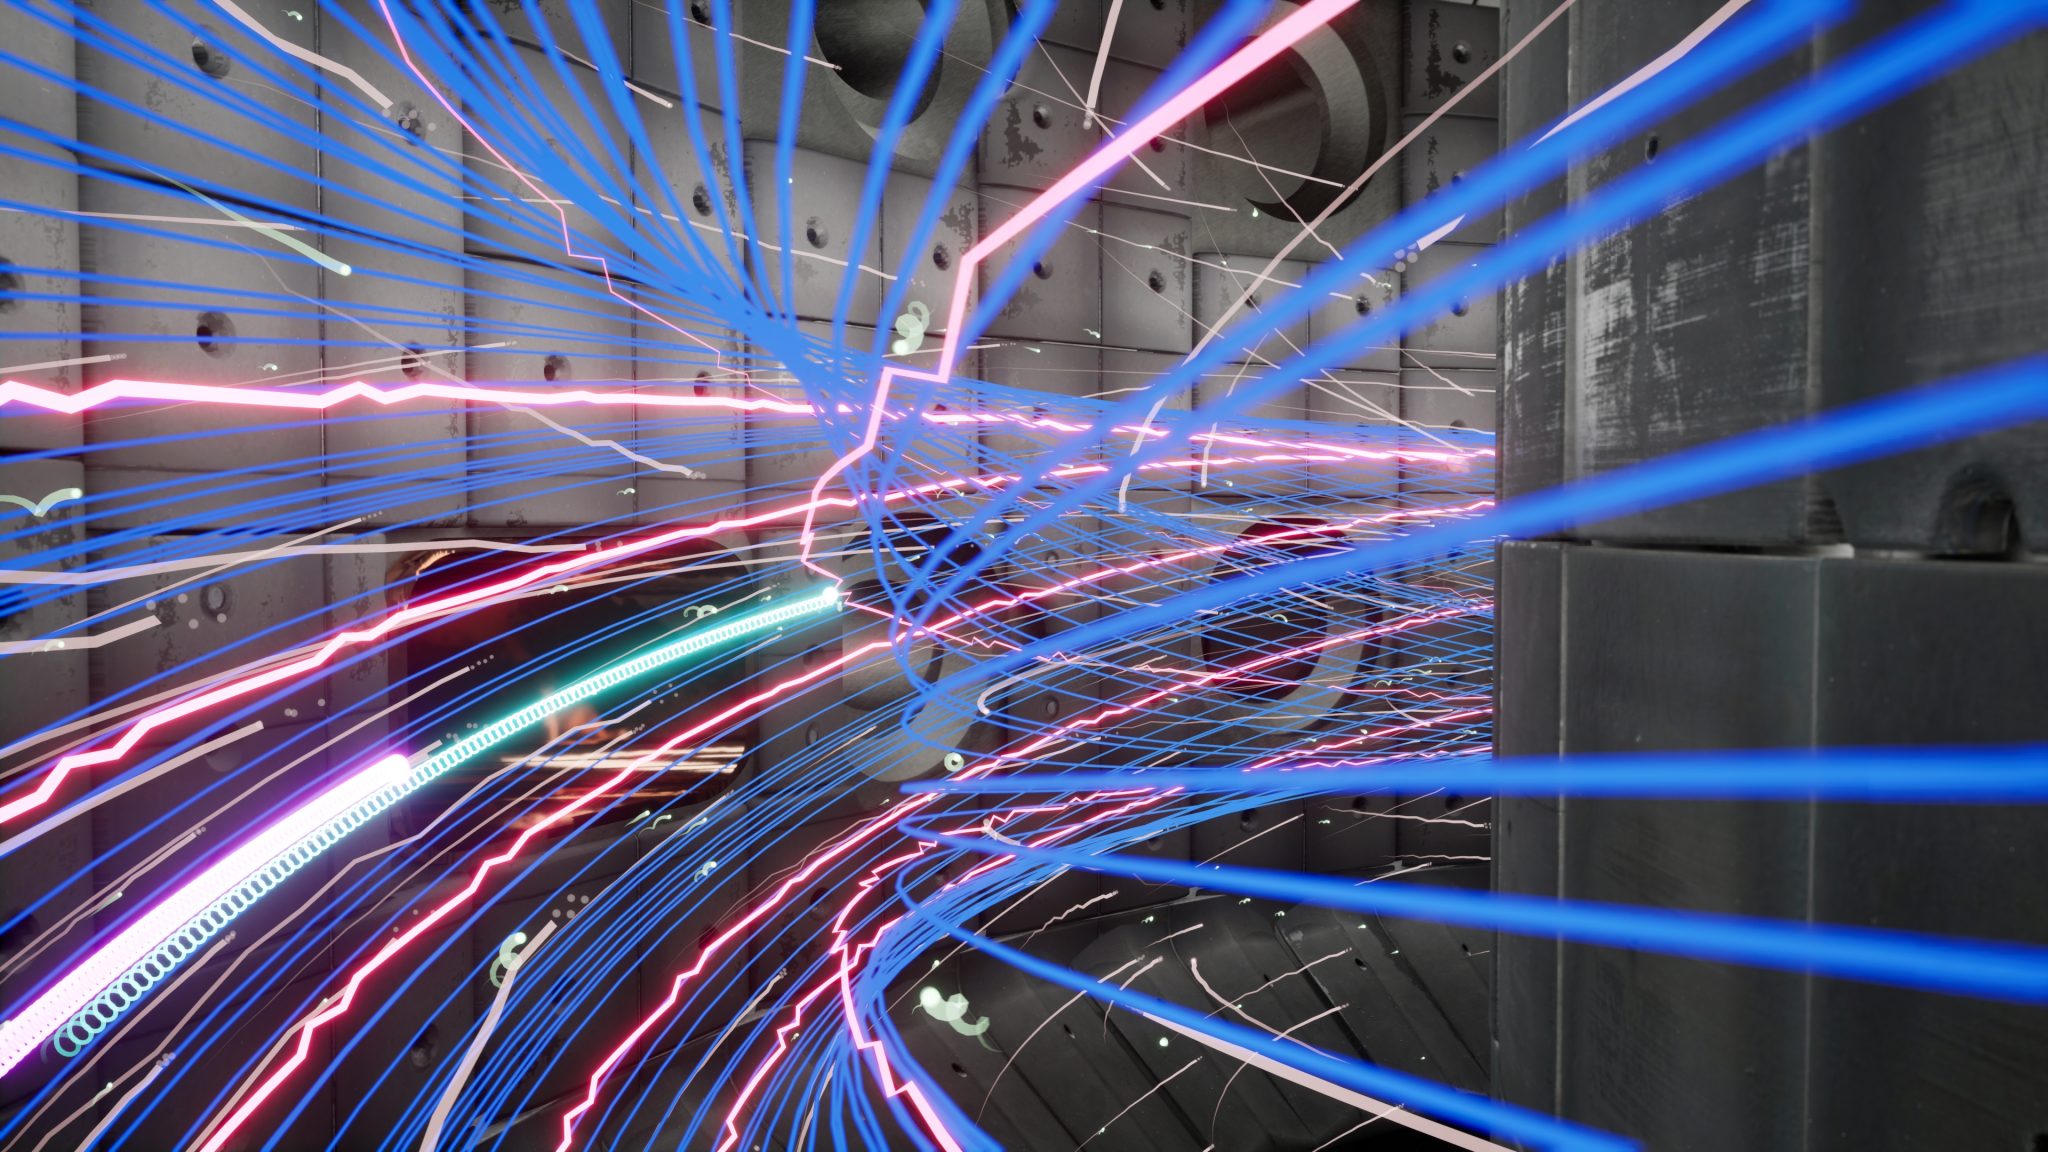
(01:40) Then, the focus shifts to observing the same particles, now in a neutral white color. We specifically highlight two particles: a fast red electron and a slower green proton. This visualization provides a detailed view of their general movement, displaying a long trail that illustrates their complete toroidal motion. It’s noteworthy to observe how well the electron aligns with the magnetic field (blue). The electron’s high speed almost visually recreates the magnetic field with its trail. The perspective also shows a cyan and purple particle, representing trapped protons. These particles follow an orbit but are confined to a back-and-forth movement. With prolonged observation, the shape of their movement would have become even more reminiscent of a banana.
 It’s noteworthy to observe how well the electron aligns with the magnetic field (blue). The electron’s high speed almost visually recreates the magnetic field with its trail.
(02:22) At this point, a volumetric rendering of the preceding green and red particles becomes visible. Specifically, this represents their density within the torus. In the center of the torus, particles are denser and travel faster. Using a 3D grid, we illustrate these aspects with color and movement.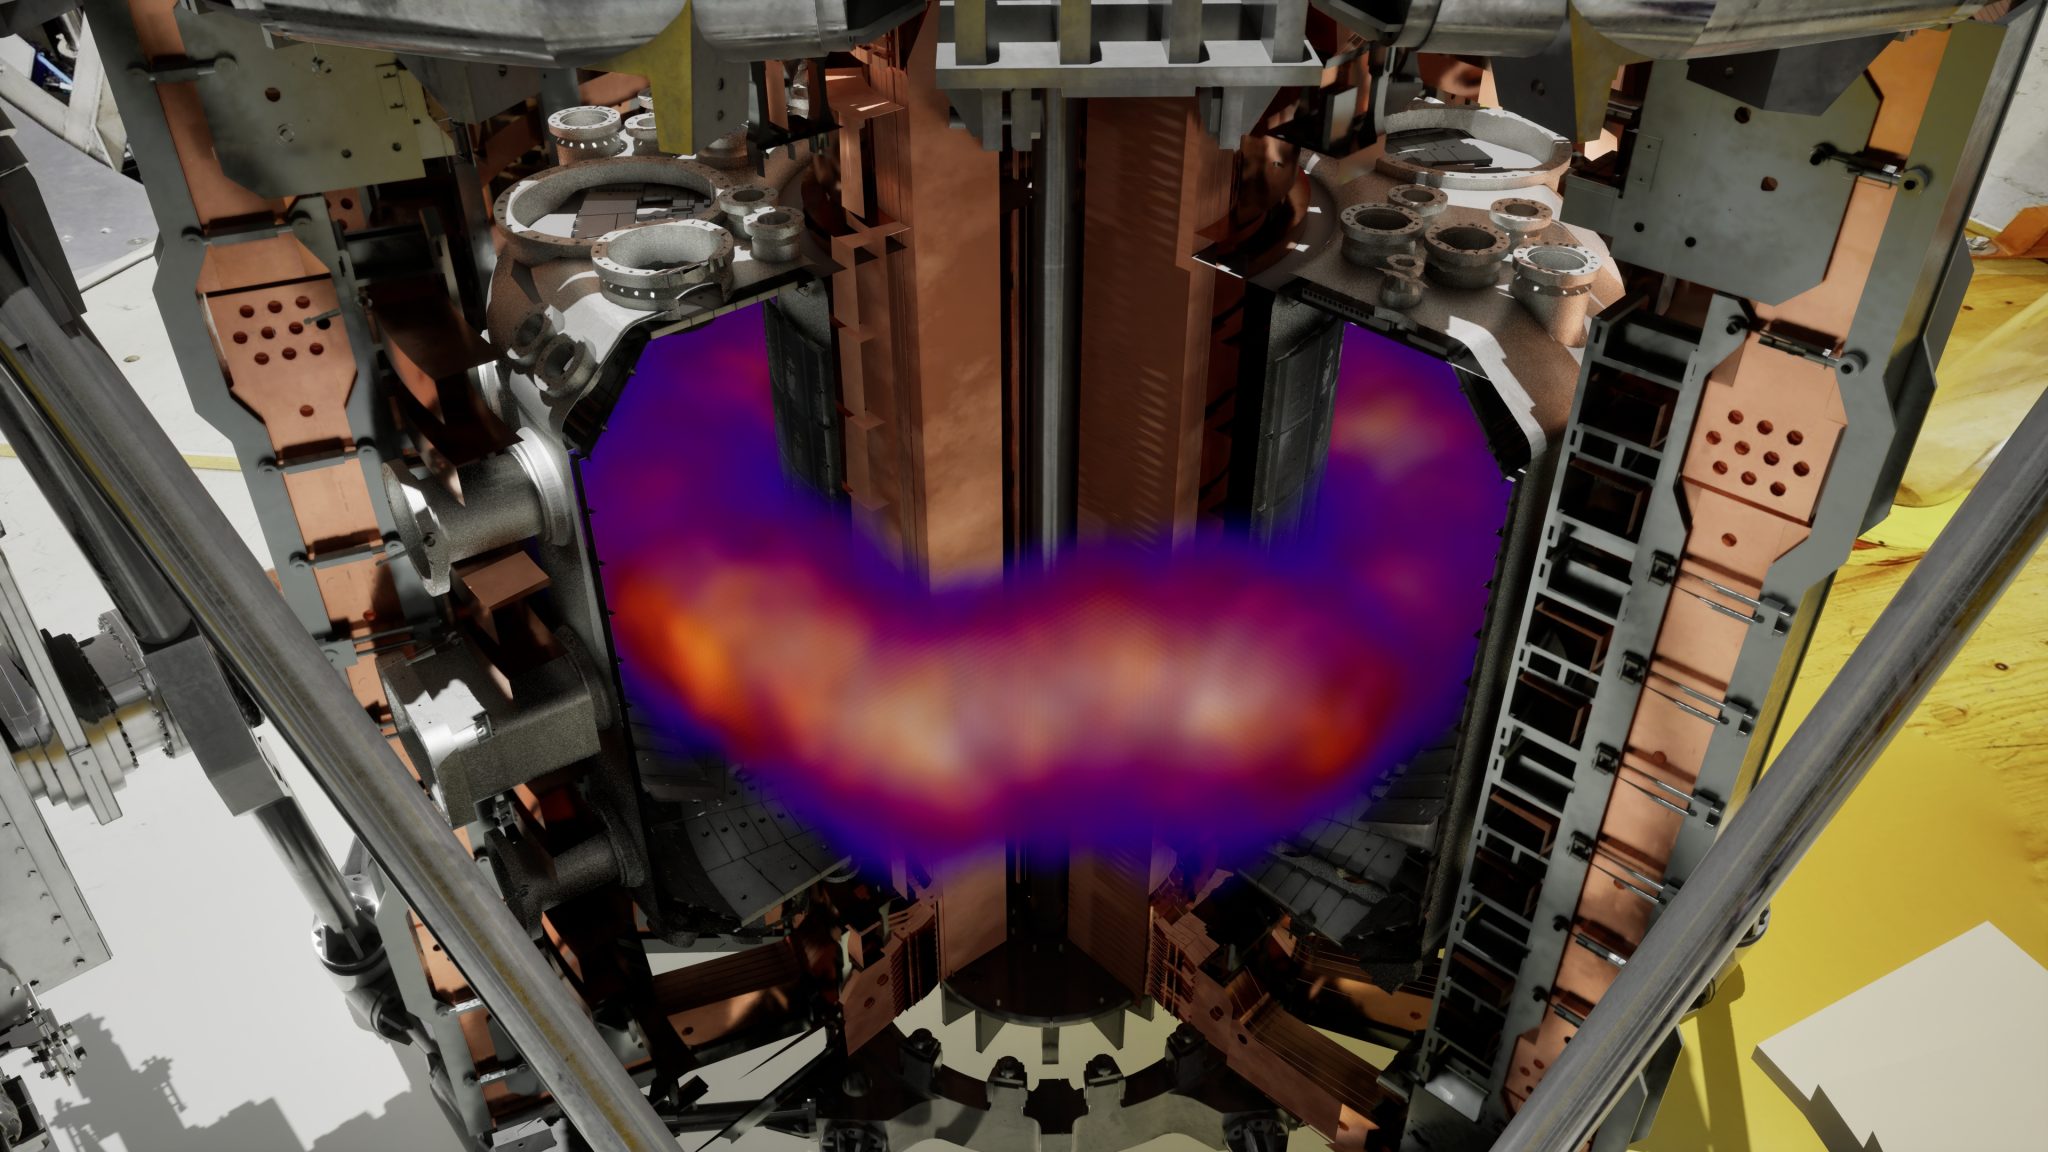
(02:32) What’s displayed now presents another volumetric representation of the data, utilizing a ‘solid’ rendering. This serves as a demonstration of the diverse visual representation possibilities available.
(03:00) The video concludes with a panoramic view of the tokamak and an NBI. To give a general sense of their scale, we also see with a scientist standing next to them.