Mobile sensors to monitor traffic conditions
Study site and Data
Downtown Yokohama’s road network includes streets of various types, with closely spaced signalized intersections at its center (100–300 m), and a few elevated freeways. Streets have 2–4 lanes in each direction. The speed limit is 50 km/h on arterials. Major intersections are centrally controlled by multiphase traffic signals with a cycle time that responds to traffic conditions: 110–120 s long at night and 130–140 s during the day. The part of downtown Yokohama examined in this work is approximately a 10 km2 triangle with corners at Yokohama Station, Motomachi-Chukagai Station and the Shin-Hodogaya Interchange. The center of this region is congested during the weekday’s peaks, with average speeds dipping below 10 km/h. Data include 140 taxis equipped with GPS and a data logger reported their position and other data with suitable time stamps. Relevant data included activations and deactivations of the parking brake, left blinker and hazard lights, as well as the beginning and end of all stops lasting more than a few seconds.
Task and results
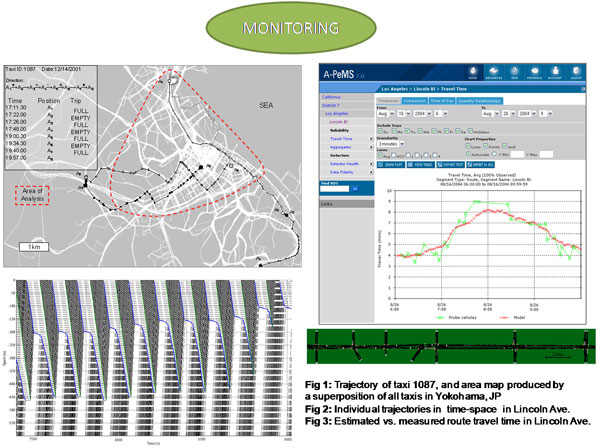
We are developing a filter to distinguish between passenger-carrying and empty taxis. In that way we could monitor traffic conditions of normal cars, by assuming that full taxis have similar behavior with normal cars. The filter first determined with some simple criteria whether a taxi stop involves a passenger boarding or alighting. The basic idea is that stops related to passenger moves are longer. We then determined with other criteria whether trips between these types of stops were full (i.e. passenger-carrying) or empty. The idea now is that taxi moves are more circuitous when looking for passengers. The filter seems to produce reasonable results. Fig. 1 shows by means of white lines the complete set of taxi routes for one week, which accurately reproduce the area’s map. The perimeter of A is shown by a dashed red line. The figure also shows the trajectory of a taxi for 3 hours. The large symbols are stops for loading or unloading a passenger. Smaller symbols show the position of the taxi every 30 s. When the taxi is empty these symbols are close together and the route is circuitous. When the taxi is carrying a passenger, the symbols are more widely spaced and the route is more direct.
Fixed sensors to develop performance measures for urban arterials
Study site and Data
The selected test site is a 2.3km long stretch of a major urban arterial north of the Los Angeles International Airport, between Fiji Way and Venice Boulevard in the cities of Los Angeles and Santa Monica. The study section includes 7 signalized intersections with link lengths varying from 500 to 1,600 feet. The number of lanes for through traffic per link is three lanes per direction for the length of the study area. Additional lanes for turning movements are provided at intersection approaches. The free flow speed is 35 mph. Traffic signals are all multiphase operating as coordinated under traffic responsive control as part of the Los Angeles ATSAC central traffic control system. Basic data on intersection geometrics, spacing and free-flow speeds were obtain from field surveys. Next, manual turning movement counts at each intersection and floating car studies were undertaken for a four hour period (6-10 am) on Wednesday May 26th. The study period enabled us to obtain data for a wide range of traffic conditions. Finally, the loop detector and signal timing data for the study period were obtained from the traffic control system database.
Task and results
We have developed an analytical model to estimate arterial travel times based on surveillance data (flows, occupancies) from conventional loop detectors and signal settings from the signal control system. The model uses kinematic wave theory to model the spatial and temporal queuing at the traffic signals and considers the signal coordination in estimating traffic arrivals at the intersection. Important extensions and refinements to the model include treatment of long queues and queue spillovers. The model is also modified to construct trajectories of individual vehicles in the time-space and estimate queue lengths along with other performance measures (Fig. 2). We also integrate the model into an archival data management system for continuous measurement and monitoring of traffic performance along arterials (fig. 3).
References
Geroliminis, N. & Daganzo, C.F. (2008) Existence of urban-scale macroscopic fundamental diagrams: Some experimental findings, Transportation Research part B, 42 (9), 759-770
Skabardonis, A. and Geroliminis, N., Real-Time Monitoring and Control on Signalized Arterials, (2008), Journal of Intelligent Transportation Systems Technology, Planning, and Operations, 12 (2), 64-74
Geroliminis N., Skabardonis A., 2006, Real-time vehicle reidentification and performance measures on signalized arterials, 9th International IEEE Conference on Intelligent Transportation Systems, Toronto, Canada
Geroliminis N., Skabardonis A., 2005, Prediction of arrival profiles and queue lengths along signalized arterials using a Markov decision process, Transportation Research Record, 1934, 116-124