Traffic congestion can be modeled in two different ways: (i) disaggregate models that describe the city and its transport activity in great detail, and (ii) aggregate models that treat vehicles and people as masses. Disaggregate models are appealing because they describe behavior (at least in theory) very precisely and model the location and speed of each particle (car) on a city network. But they require mountains of data that are difficult to obtain and they cannot be expected to produce reliable outputs. On the other hand, if we model transport in an aggregate way, like a water basin (a reservoir) where the number of vehicles is its state variable, this kind of model includes inputs and outputs that are more readily observable with existing monitoring techniques.
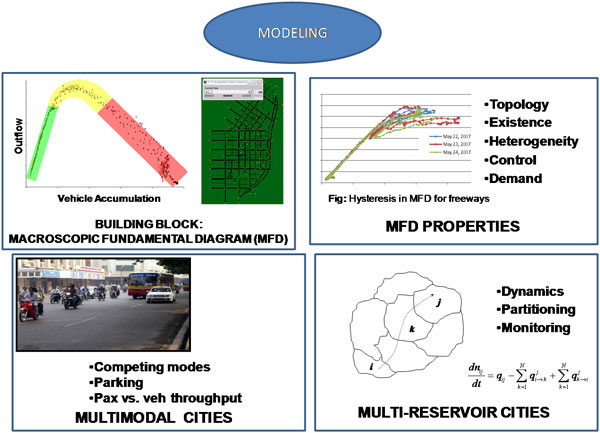
The building block of our approach is the Macroscopic Fundamental Diagram (MFD). Geroliminis and Daganzo (2007, 2008) showed using a micro-simulation of the San Francisco Business district and a field experiment in downtown Yokohama (Japan), (i) that (roughly) homogeneous urban regions approximately exhibit an MFD relating the number of vehicles (accumulation) in the region to the region’s average speed (or flow) and (ii) there is a robust linear relation between the region’s average flow, which can be estimated using monitoring techniques and its total outflow (rate vehicles reach their destinations), which is difficult to observe. In the MFD, flow increases with accumulation up to a sweet-spot, and for higher values of accumulation (higher levels of congestion) flow decreases towards zero until the network approaches a gridlock state. The experiment used a combination of fixed detectors and floating vehicle probes as sensors.
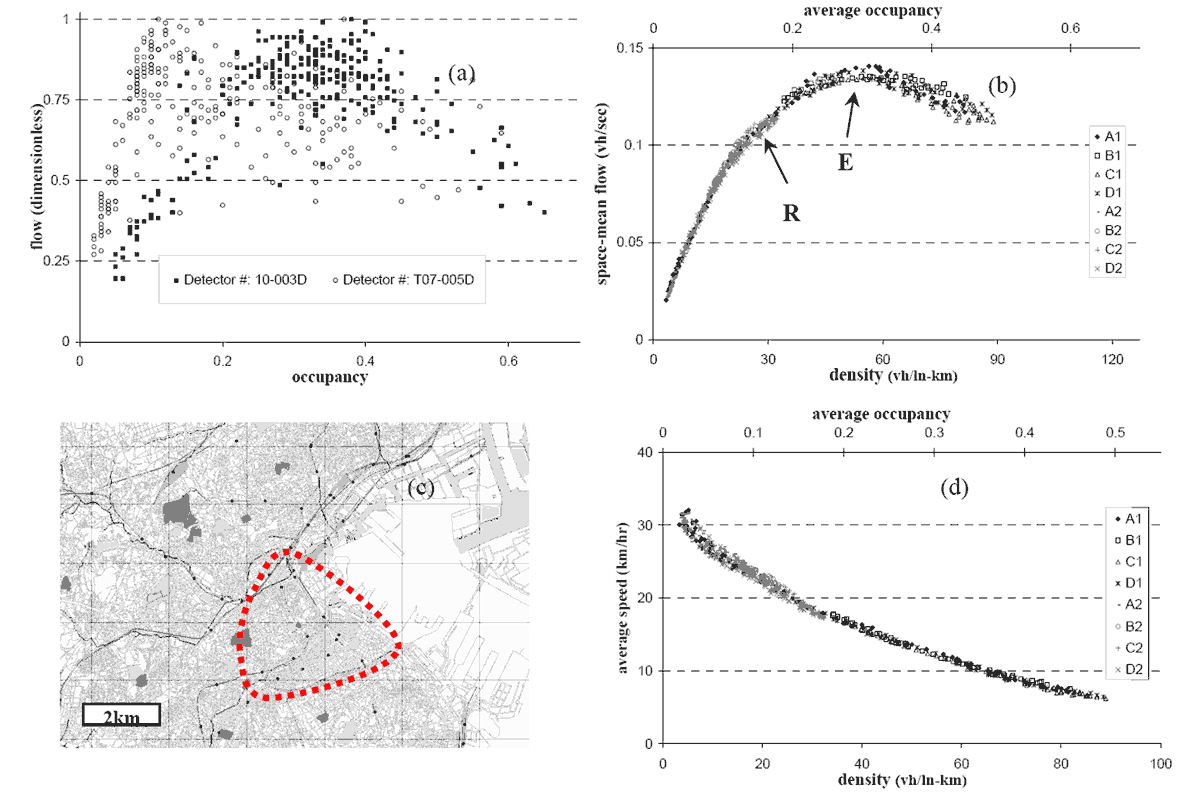 Fig. 1: click to enlarge
Figure 1 shows some findings of the experiment in Yokohama (time resolution is 5min). It was observed that when the somewhat chaotic scatter-plots of speed vs. density from individual fixed detectors were aggregated for a 10km2 region, the scatter nearly disappeared and points grouped neatly along a smoothly declining curve (compare fig. 1a with 1b-1d). The same references also showed that (a) the MFD is a property of the network itself (infrastructure and control) and not of the demand, i.e. the MFD should have a well-defined maximum and remain invariant when the demand changes both with the time-of-day and across days (it may vary if the O-D pattern of demand changes significantly, though, e.g. due to an event or evacuation); (b) the space-mean flow, is maximum for the same value of density of vehicles or average speed, independent of the origin-destination tables and (c) the average trip length for the study region is about constant with time, i.e. the total outflow vs. density curve is a scaled up version of the curve in fig. 1b.
References
Geroliminis, N. & Daganzo, C.F. (2008) Existence of urban-scale macroscopic fundamental diagrams: Some experimental findings, Transportation Research part B, 42 (9), 759-770
Daganzo, C.F., & Geroliminis, N., (2008), An analytical approximation for the macroscopic fundamental diagram of urban traffic, Transportation Research part B, 42 (9), 771-781
Geroliminis N., Daganzo C.F., (2007), Macroscopic modeling of traffic in cities, 86th Annual Meeting Transportation Research Board, Washington D.C.
Daganzo, C.F. (2007) “Urban gridlock: macroscopic modeling and mitigation approaches” Transportation Research B 41, 49-62