Continuous-Flow Streamwise Thermal Gradient Cloud Condensation Nuclei (CCN) Counter (CFSTGC)
CURRENT RESEARCH
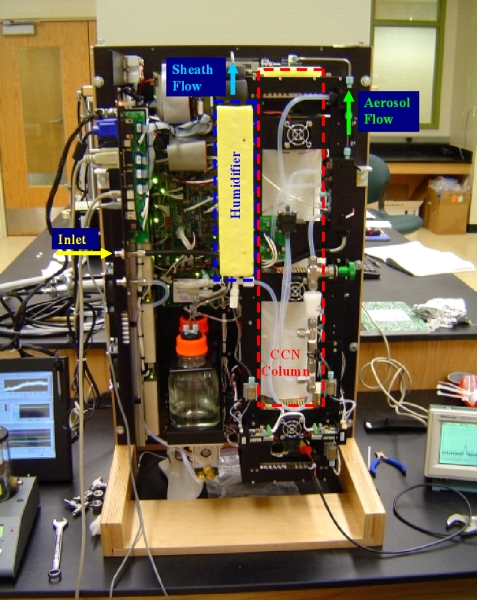
Developed by Droplet Measurement Technologies, the CFSTGC is based on a concept by Roberts and Nenes [2004]. The instrument counts the fraction of aerosol particles that become droplets when exposed to a given water vapor supersaturation (RH > 100%).
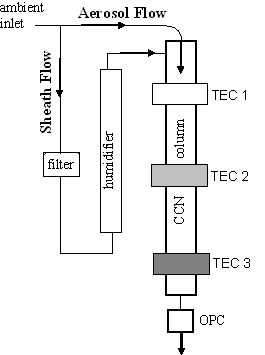
Schematic of the CCN Counter: The ambient inlet is split into aerosol and sheath flow. The sheath flow is filtered, humidified and heated. The two flows meet at the top of the CCN column. The CCN column is where supersaturation is generated and particles grow to become droplets, which are then large enough to be detected by an Optical Particle Counter (OPC). The inner walls of the CCN column are maintained moist. The aerosol flow is directed through the centerline of the column, and is surrounded by an annular flow of particle free sheath air.
As with all CCN counters, a temperature gradient is applied to produce a supersaturation of water vapor. However, the mechanism for generating supersaturation is not the same for all CCN counters. For example, for continuous flow parallel plate diffusion chambers, the temperature gradient is perpendicular to the flow, and supersaturation is a result of the nonlinear dependence of vapor pressure upon temperature. The same mechanism applies for static diffusion cloud chambers, where there is no flow at all.
However, as the name implies, for the Continuous Flow Streamwise Thermal Gradient CCN Counter, the temperature gradient is in the streamwise direction (maintained by thermoelectric coolers). In this case, supersaturation results as a consequence of the greater rate of mass transfer over heat transfer, as explained below.
Thermal Diffusivity < Molecular Diffusivity of Water Vapor
With laminar flow, heat and water vapor are transferred to the centerline of the column from the walls only by diffusion.
Since molecular diffusivity is greater than thermal diffusivity, the distance downstream that a water molecule travels before reaching the centerline is less than the distance the heat travels downstream before reaching the centerline. If you pick a point at the centerline, the heat originated from a greater distance upstream than the water vapor.
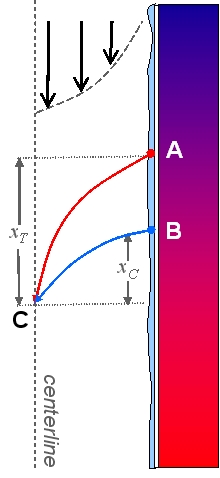
There are four facts that are necessary to explain how supersaturation is generated within the CFSTGC:
1) Assuming that the inner surface of the column is saturated with water vapor at all points, since the temperature is greater at point B than at point A, the water vapor partial pressure is also greater at point B than at point A.
2) The actual partial pressure of water vapor at point C is equal to the partial pressure of water vapor at point B.
3) However, since the temperature at point C is the same as at point A, the equilibrium water vapor pressure at point C is equal to the water vapor partial pressure at point A.
4) The saturation ratio is the ratio between the actual partial pressure of water vapor and the equilibrium vapor pressure. This is equivalent to the partial pressure at point B divided by the partial pressure at point A, which is always greater than one. Thus supersaturation is generated through a dynamic equilibrium.
Citations:
1) Roberts, G., and A. Nenes (2005). “A Continuous-Flow Streamwise Thermal-Gradient CCN Chamber for Atmospheric Measurements”, Aeros. Sci. Tech., 39, 206−221.
Continuous-Flow Streamwise Thermal Gradient Cloud Condensation Nuclei (CCN) Counter (CFSTGC):
Mapping the Instrument Performance
The CFSTGC can generate supersaturations (SS) within the range of 0.06% – 3%, though we generally operate below 1% SS since this is the highest supersaturation expected for clouds. Unfortunately, water vapor supersaturation of such low magnitude cannot be measured directly very precisely. Any probe that enters the region of supersaturation will experience condensation, thereby affecting the measurement. Another potential mechanism for measuring the supersaturation is by absorption of infrared radiation, but this will heat the water vapor being measured and will lower the supersaturation. Instead, we use a fluid dynamics model to understand and predict the supersaturation that is generated within the CCN column of the CFSTGC. The temperature gradient, total volumetric flow rate and pressure are needed as inputs to the model. The higher the pressure, total volumetric flow rate and temperature gradient, the higher the supersaturation.
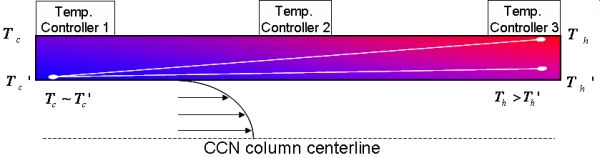
Figure 1.
Radial cross-section of the CFSTGC turned on its side. The laminar flow of air is from left to right as depicted in the image (in reality, flowing downward towards the heated end of the column). The centerline of the column is at the bottom of the image, and the column wall is depicted with colors that represent the wall temperature (blue = cold and red = hot). The outer wall temperature is represented by Th (hot) and Tc (cold) and the inner wall temperature by Th’ (hot) and Tc’ (cold). Both the inner wall and outer wall temperature gradients are depicted with white lines, that digress from each other more and more approaching the exit of the column.
One of the biggest uncertainties of the model is the actual temperature inside the column, which controls supersaturation. Unfortunately, this temperature is not directly measurable. Instead, we control the temperature of the outside of the column. Not taking into account the temperature drop through the column walls can lead to a significant overestimate of supersaturation.
To get around this problem (and for validation of the model), we calibrate the instrument supersaturation by introducing aerosol of known particle size and chemical composition (e.g. pure NaCl) into the instrument. There is a well-known theory for the supersaturation needed to “activate” a NaCl seed particle of a given size [Kohler, 1936]. Once the particle’s “critical supersaturation” is attained, the particle grows very quickly (by condensation) into a cloud droplet, and is subsequently detected by the downstream Optical Particle Counter (OPC). The following figure demonstrates how we determine the instrument supersaturation from the experimental “activation curve” (at the point where 50% of the particles activate). The particle critical supersaturation (the supersaturation required for a particle to activate) is inversely related to the size of the particle.
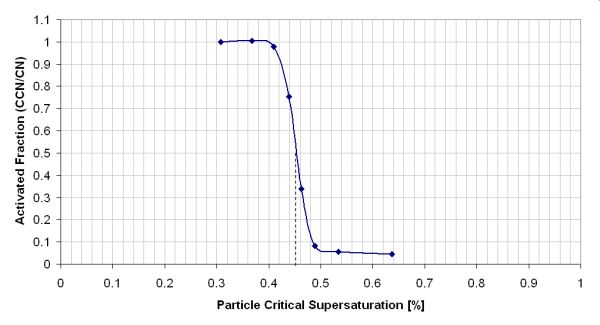
Figure 2.
Example of an “activation curve”. The conditions within the CCN column are kept the same for the entire experiment and each point represents a different particle size, classified from a laboratory-generated NaCl aerosol. As the particle size increases (and thus the particle critical supersaturation decreases), a larger fraction of the particles are able to activate (or become cloud droplets).
The supersaturation that is inferred from the particle growth tells us what the actual temperature must have been inside the column. We then compare this temperature with the imposed temperature, according to the following definition for “thermal efficiency”.
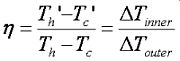
Thermal efficiency changes with the instrument operating conditions. For example, a higher flow rate leads to greater cooling at the inner walls of the column by forced convection, which leads to a larger temperature drop through the column walls and a lower thermal efficiency. Instead of calibrating the instrument for every set of operating conditions, we instead infer the overall thermal resistance of the materials in the column wall. Thermal resistance is a property of the materials and their thicknesses, and does not change significantly with the instrument operating conditions.
Once the thermal resistance is determined using a separate heat transfer model, the thermal efficiency can be predicted for any set of operating conditions using the fluid dynamics model. Once the true temperature within the column is known, the supersaturation can be accurately calculated.
We also use a droplet growth model to determine the size of the droplets at the exit of the CCN column, and the efficiency of droplet detection by the Optical Particle Counter (OPC), for different operating conditions and different types of aerosol particles.
The paper describing this research is:
Lance, S., J. Medina, J.N. Smith and A. Nenes (APR 2006). “Mapping the operation of the DMT Continuous Flow CCN counter”, Aerosol Sci. Technol., 40 (4): 242−254.
Citations:
1) H. Kohler (1936). “The Nucleus in and the Growth of Hygroscopic Droplets.” Trans. Faraday Soc. 1152−1161