Research aim
The endoproteases Furin, PACE4, PC5(6) and PC7 cleave secreted proproteins after the consensus motif (K/R)-(X)n-(K/R)↓, where n is 0, 2, 4 or 6 and X can be almost any amino acid. Partial functional redundancy among PCs and their conserved catalytic domains complicates the identification of physiological substrates. Live imaging suggests that substrate specificity is influenced by differential trafficking, thus pointing to new opportunities for selective drug targeting.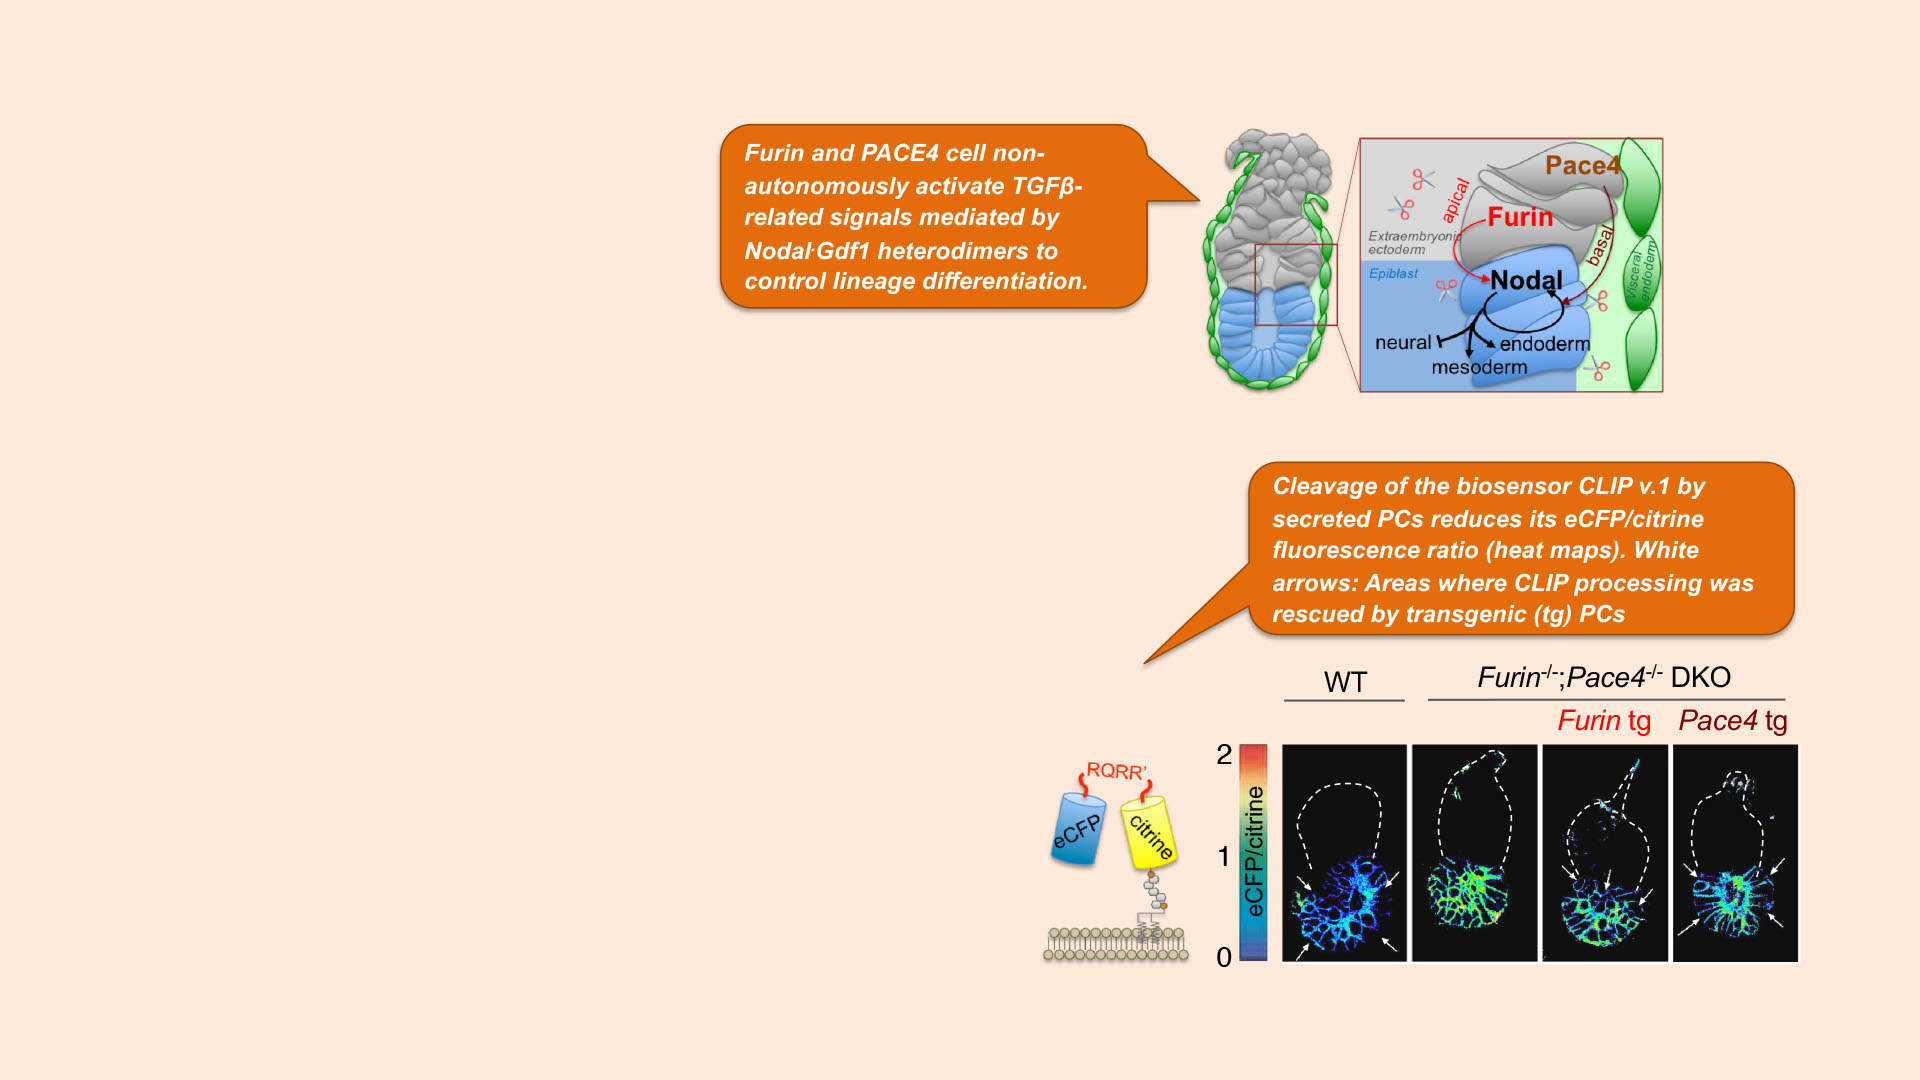
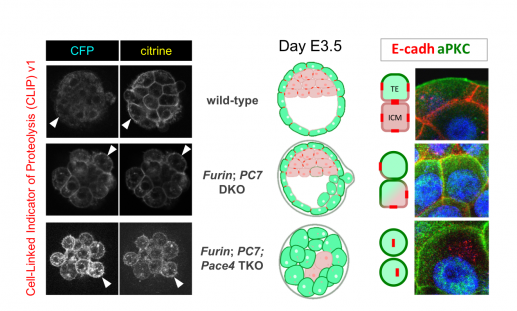
CLIPv1 imaging of PC activities during morula compaction.
The least understood PC family member is PC7, which we discovered in a screen for novel PCs. Deletion of PC7 alone did not impair normal development. However, combined inactivation of Furin and PC7 delayed E-cadherin precursor cleavage and morula compaction. CLIP imaging confirmed that PC7 and Furin were already active at the morula stage (Bessonnard et al., 2015). By contrast, Pace4 activity only appeared later, coinciding with its expression in outer cells and with partial restoration of E-cadherin function. Thus, CLIP imaging affords unprecedented resolution to map overlapping and dynamic PC activities.
Bessonnard et al. 2015
Left: CLIP v.1 imaging in mouse morulas of the indicated genotypes. Right: Blastocysts stained with anti-E-cadherin (red) and anti-aPKC antibodies (green). Failure to process and stabilize E-cadherin in adherens junctions leads to ectopic aPKC accumulation and induces pluripotent ICM to differentiate into TE cells.
PC imaging at subcellular resolution
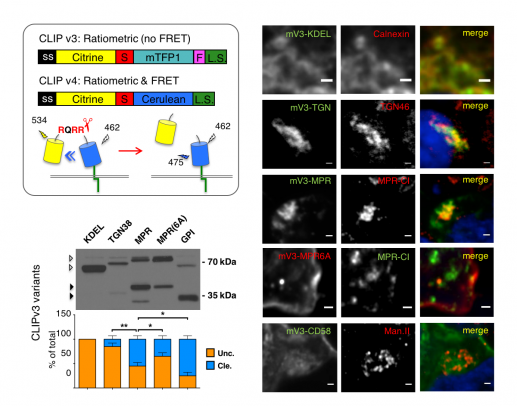
To map where a given PC activity is enriched, we introduced the improved biosensor versions CLIP v.3 and v.4 and corresponding cleavage mutant controls (mCLIP) and fused them to alternative localization signals. Western blot and pulse chase analysis in stable cell lines revealed that CLIP v.3 variants were cleaved at different rates, depending on their localization (Ginefra et al., 2018). Comparison with mCLIP v.3 variants or with ER-specific biosensor CLIPv3-KDEL confirmed that cleavage was specific and dependent on PCs in post-ER compartments (not shown).
Ginefra et al., 2018
Top left: Excitation and emission wavelengths to estimate CLIP v.4 cleavage by sensitized emission analysis of Förster resonance energy transfer (FRET) from cerulean (donor) to citrine (acceptor). S: PC cleavage site; L.S.: Localization signal. Right: Localization of cleavage mutant mCLIP v.3 variants (left column) in HEK cells stained for the indicated markers (middle column). Merged channels in the right-most column include DAPI staining (blue). Bottom left: Anti-Flag Western blot of the indicated CLIPv3 variants in HEK cell extracts. Cleavage efficiency is plotted below as % of total (cleaved uncleaved).
Complementary distribution of Furin and PC7 activities
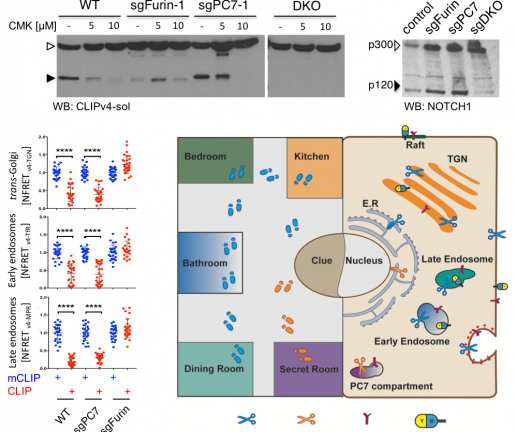
Interestingly, FRET imaging of CLIP v.4 in three unrelated cell lines revealed a >3-fold higher PC activity in endosomes than in the TGN or at the cell surface. Furthermore, deletion of Furin in B16-F1 cells blocked CLIP v.4 cleavage in each of these compartments. By contrast, deletion of PC7 had no effect even though it was expressed and active, contributing to the cleavage of both secreted CLIP v.4 and of transfected Notch1 precursor in a compartment that resists treatment with the pan-PC inhibitor decanoyl-RVKR-chloromethylketone (CMK). These findings suggest that Furin and PC7 define distinct processing compartments. Future studies will assess whether their compartmentalization can be exploited to preferentially block oncogenic PC functions without disrupting the maturation of E-cadherin and other tumor suppressors that traverse more than one PC compartment.
Mapping PC activities individually
Top: Western blot of soluble CLIP v.4 and of myc-tagged Notch1 in control B16-F1 cells or CRISPR-edited clones lacking Furin, PC7 or both (DKO). Bottom left: FRET signal of the indicated CLIP v.4 variants normalized to maximal average FRET of corresponding cleavage mutant mCLIP v.4 control constructs. Data points represent average NFRET across one entire cell (****p<0.0001, Student’s t-test). Bottom right: Mapping the distribution of PC activities and their effects on substrates in specific compartments and its resemblance to a Cluedo game.
Publications related to this project
P. Ginefra; B. Filippi; P. Donovan; S. Bessonnard; D. B. Constam. Compartment-specific biosensors reveal a complementary subcellular distribution of bioactive Furin and PC7; Cell Reports. 2018. DOI : 10.1016/j.celrep.2018.02.005.
S. Bessonnard; D. Mesnard; D. B. Constam. PC7 and the related proteases Furin and Pace4 regulate E-cadherin function during blastocyst formation; The Journal of Cell Biology. 2015. DOI : 10.1083/jcb.201503042.
D. Mesnard; M. Donnison; C. Fuerer; P. L. Pfeffer; D. B. Constam. The microenvironment patterns the pluripotent mouse epiblast through paracrine Furin and Pace4 proteolytic activities; Genes & Development. 2011. DOI : 10.1101/gad.16738711.