On some tools, it is sometimes possible to see the sample during the process through a viewport, which can give a subjective idea of its current state. Nevertheless, precise and live control of the etching process is essential to allow for proper end detection. Depending on the tools, several live monitoring systems are available: Optical Emission Spectroscopy (OES), Laser reflectometry/interferometry, Secondary Ions Mass Spectroscopy (SIMS).
Optical emission spectroscopy is a technique that will exploit characteristic optical emission that appears during chemical reactions between etchant and target species.
This end-point detection method can be used in two ways:
- Observing the evolution of the light intensity of the plasma as a whole
- Discretizing a spectrum wavelengths to monitor the intensity change of a specific one through time
During an etch process, reactive species from the plasma that interact with the target material to etch will generate light intensity level that will add up to that of base plasma. Overall light intensity level of an arbitrary unit can serve as an indicator for process completion when the target material is fully gone and only the base plasma remains: when the reactive species in the plasma cease interacting with the sample, a drop in overall intensity occurs.
When discretizing the plasma spectrum, information about a particular specie that is known to emit a certain wavelength when created as etch reaction by-product, can be followed through time.
Below, an example of optical emission spectroscopy detection curve during a plasma O2 cleaning: the magnitude of the followed wavelength is monitored through time, showing a drop when emitting by-products are not present anymore, confirming that the cleaning is finished and that the process can be stopped.
Available on Synapse, APS, Cobra, Rapier and TEL Unity
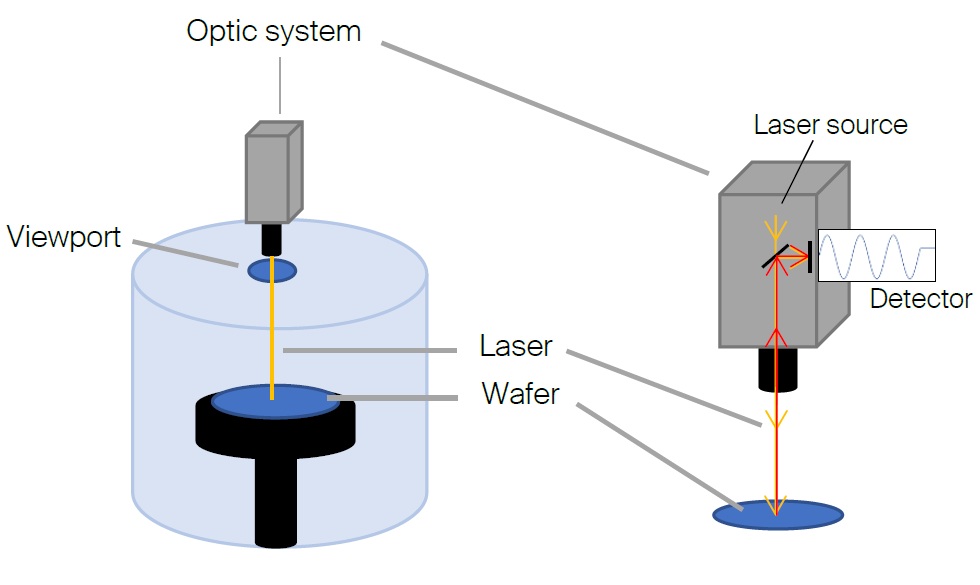
Laser interferometry/reflectometry end point detection system uses an external laser beam to track the etch depth and etch rate of the sample. The laser beam is oriented such that it lands at normal incidence on the sample surface so part of it can be reflected back up to the integrated optical system for analysis.
Interferometry
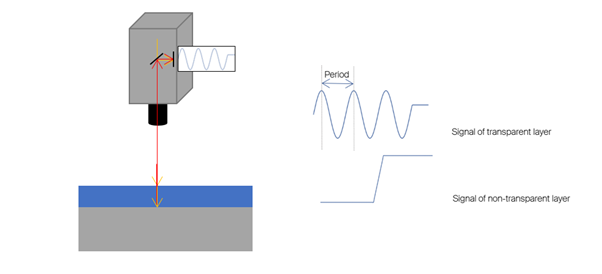
A part of the laser beam is reflected on the top surface of sample while the other part of the beam goes through and before it partly reflects back up from the interface with a second layer that is beneath. Both reflected laser beams superimpose on the detector and interfere in a constructive or destructive manner, creating a periodic sinusoid signal on a graph.
The period of a the sinusoid graph gives info about relative etch rate of materials: the faster the period of the sinusoid, the faster the etch rate of the material. On the graph below, ECI resist (blue) etches way faster that SiO2 (orange).
From 1/2 a period of this sinusoid graph, a precise etch rate can be calculated.
Reflectometry
If the material on top surface of sample is not transparent to the laser wavelength, single laser beam reflection happens, no interference occurs and the graph shows a rather flat line (proportional to the reflected light intensity).
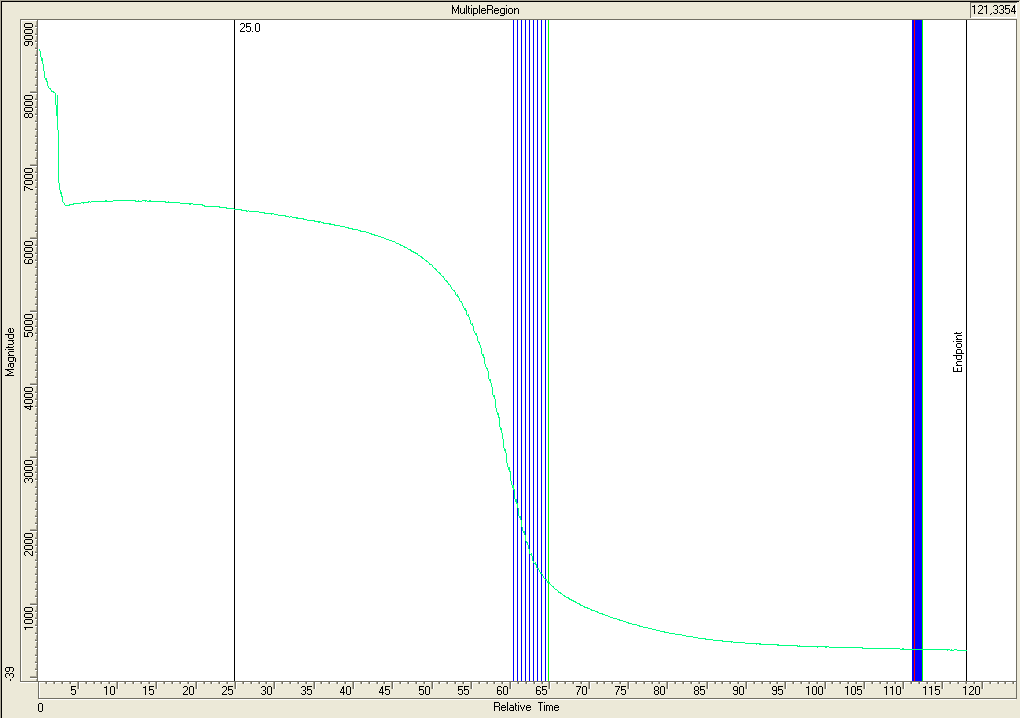
No matter whether the material is transparent or not, the end of the etch can be detected in real-time graph due to sudden optical variation in the signal, such as a change in reflection intensity or a change in the signal’s periodicity. On the graph below, the transition between a Mo top layer fully etched to a partial etch of an AlN layer is clearly visible.

Available on Synapse & APS & AMS & Cobra & RIE 2 with λ = 670nm, Multiplex with λ = 905nm and Rapier with λ = 980nm.
Secondary Ions Mass Spectroscopy (SIMS) uses the mass-to-charge ratio to determine which species are present in the chamber. The etching process sputters ions from the etched surface of the sample, and they are said to be secondary ions because not present if no etch. Part of these secondary ions are collected and a mass analyser (quadrupole) isolates them according to their mass in order to determine their elemental composition. A detection system (electron multiplier) amplifies the signal and displays it in real time as counts/seconds (i.e. signal magnitude).
Note : if the masses of all layers to etch are too close from one another, or close to that of the primary etch specie, sorting out the elemental composition can be hard to make.

Available on Nexus IBE.