Nonlinear Microscopy

#unfortunately nothing here
Two-Photon and Second Harmonic Imaging
From our work on nonlinear light scattering it has emerged that the throughput of a label-free second harmonic generation (SHG) experiment can be enhanced by using a wide-field imaging scheme in combination with a medium-range repetition rate femtosecond laser source and gated detection. The rational for this design can be found here (page 4). The layout of our wide field design is sketched below.
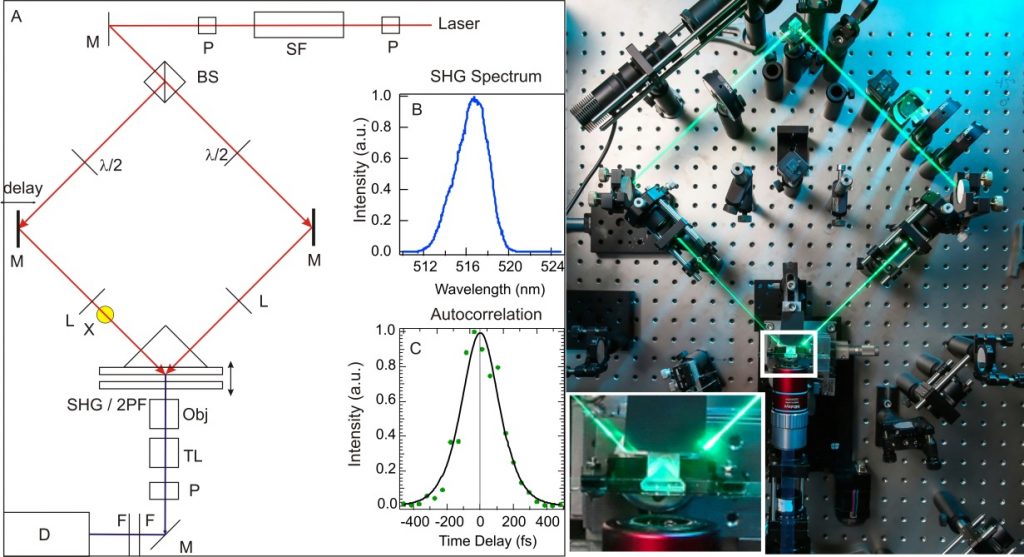
Optical Layout. Left: (A) The optical layout of the microscope. Symbols: P: polarizer, SF: spatial filter, M: mirror, λ/2: half wave plate, L: lens, Obj: objective lens, TL: tube lens, F: filter, D: Detector. The sample cell is configured with two glass coverslips in between which a liquid flow can be established. (B) The spectrum of the second harmonic beam generated at the sample. (C) The intensity cross-correlation, measured with a single BaTiO3 nanoparticle in the focus and varying the temporal delay. From: Opt. Express (2014) 22 (25), 31102-31112. Right: Picture of the microscope. Source: Alain Herzog/EPFL.
In a different implementation we use a 3D structurally illuminated wide-field second harmonic microscope.
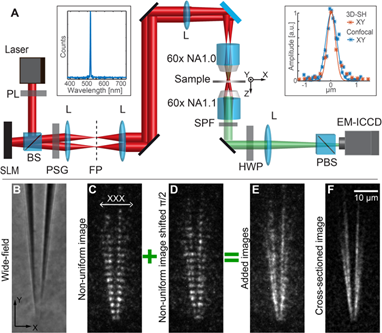
Optical system employing 3D structural ilumination and capillary imaging. (A) Schematic of the 3D second harmonic microscope; SLM – spatial light modulator, PL – polarizer, BS – beam splitter, PSG – polarization state generator, L – achromatic lens, NA – numerical aperture, SPF – short pass filter, HWP – half wave plate, PBS – polarizing BS. Inset: Obtained SH spectrum from the capillary interface (left), and transverse resolution (right) of the system (red) and that of a commercial scanning multiphoton microscope (blue, Leica SP5, NA 1.2). (B) Phase contrast image of the micro-capillary in aqueous solution obtained by placing a white light source in the beam path. (C) SH structured image without, and (D) with the pattern phase shifted by π/2. (E) Sum of (C) and (D). (F) HiLo image obtained after applying a HiLo algorithm on (C) and (E) (see Science (2017) 357, 784 for details). The SH intensity is only detectable if the polarization combination is in the XXX direction, i.e. along the surface normal.
The imaging throughput of both configurations (named WF1.0 and 3D SH) was tested by measuring the optical image contrast for different image acquisition times of BaTiO3 nanoparticles in two different wide-field setups and one commercial point-scanning configuration. We find that the second harmonic imaging throughput is improved by 2-3 orders of magnitude compared to point-scan imaging. Additional advantages are the accessibility of all 8 possible polarization combinations, the short pulse duration in the laser focus and the relatively large field of view (~140 microns in diameter). In the case of the 3D SH system a greater signal to noise ratio can be achieved for much shorter integration times, up to a factor 5000.
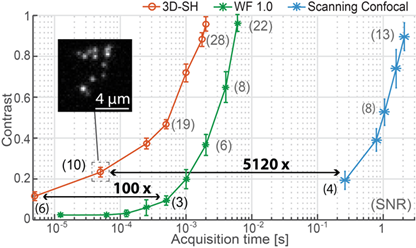
Measured imaging throughput. Comparison of imaging throughput and signal-to-noise ratio. Plot comparing the Michelson contrast from images of the same 50 nm BaTiO3 particles taken with different acquisition times using the imaging system presented here (red), a two beam wide-field SH microscope (WF 1.0, green), and a commercial scanning multiphoton microscope (Leica SP5, blue). The number in parenthesis represents the corresponding SNRs.
From: Opt. Express (2014) 22 (25), 31102-31112, and Science (2017) 357, 784.
Imaging of Interfacial Water inside a micro-capillary
Using our 3D-SH microscopes, we have explored complex aqueous interfaces, such as the inner and outer interfaces of a glass micro-capillary in aqueous solutions, subject to chemical modification and flow. Constructing 3D images of the interfacial water orientation (that comprises oriented water molecules in the first nanometer adjacent to the glass) on 250 ms timescales and with 188 nm transverse resolution, structural heterogeneities were observed. Using flow experiments surface chemical reaction rates were measured that spanned a range of 8 orders of magnitude. In addition the dynamic motion of water molecules inside a pore in response to an external electric field was measured. Not only is the method a breakthrough in measuring surface chemistry, it also shows the need to develop more sophisticated surface models. While a mean field model could capture the time and space averaged nonlinear optical response, it could not describe the local responses (see). Presumably, it is the local variations (in both time and space) that matter most for surface chemistry and not the global average. These results clearly motivate further research.
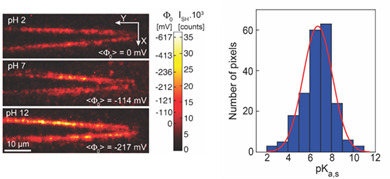
Heterogeneity of surface chemistry. Left: Surface potential/intensity maps constructed from SHG images of a micro-capillary immersed in aqueous solutions of different pH. Varying the pH upwards from the point of zero charge (pH=2), more intense SH images are recorded, as the surface electrostatic field that emanates from the charged surface (≡Si-O-) groups orients more water molecules within the 3 nm thick electric double layer. Intensity variations reflect surface potential changes three times bigger than the average. Right: Measured surface chemical equilibrium constants for the ≡Si-OH deprotonation reaction, displaying a variation of 8 orders of magnitude between the various pixels.
Cell Damage Reduced
The wide field imaging also enables much longer exposure times for live cell imaging. To quantify the damage threshold and mechanisms for photodamge, we analyzed theoretically the temperature increase in an aqueous solution resulting from illuminating with different repetition rates (keeping the deposited energy and irradiated volume constant). This analysis was complemented with photobleaching experiments of a phenolsulfonphthalein (phenol red) solution. We found that by combining medium repetition rates and wide-field illumination thermal diffusivity is promoted, which reduces photodamage and thus allows for higher peak intensities. A three day proliferation assay on living HEK cells confirms this analysis (see Figure, panel a): Proliferation was conserved after exposures of up to 72 GW/cm2 during 30 s. Proliferation was compromised after 30 s exposure to 115 GW/cm2. We also observed that proliferation depends on the exposure time when illuminating with a constant peak intensity. Proliferation was conserved after exposure to 60 GW/cm2 for up to 90 s, but the proliferation was hindered when the exposure time exceeds 180 s, which corresponded to a decay beyond 30 % in the endogenous 2PF intensity (panel b). Compared to scanning confocal systems, we thus see that dwell times can be increased by a factor of ~106 while still preserving cell proliferation. We also find that the percentage of the remaining endogenous two-photon fluorescence after exposure (i.e. endogenous photobleaching) can be used as a simple online in-situ viability test. These results are displayed in panels b and c of the below figure.
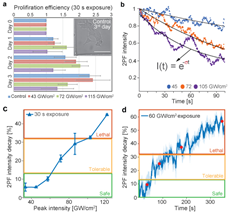
Photodamage induced in human embryonic kidney (HEK) 293 cells after illumination with 1035 nm, 170 fs, 200 kHz laser pulses with different peak intensities or exposure times. (a) Histogram of the proliferation efficiency on the first, second, and third day after 30 s exposures with different peak intensities, and an inset showing the control cells (scale bar: 50 µm). (b) Examples of the endogenous 2PF intensity decays in the HEK cells for different illuminating peak intensities. (c) Percentage of 2PF intensity lost after 30 s of exposure with the different peak intensities. (d) Percentage of 2PF intensity lost over time when exposing the cells during 370 s to 60 GW/cm^2. The red markers represent the exposure times used in a proliferation experiment. The error bars and shaded area in (d) represent the standard deviation from 20-30 measurements.
Nanodoubler imaging
Translational and rotational diffusion of biomolecules affects many aspects of cell biology, from metabolism to signal transduction. The crowded cellular environment, however, is complex and difficult to study directly. Much of today’s knowledge of biomolecule translational and rotational diffusion originates fluorescence correlation spectroscopy (FCS). FCS requires dilute solutions and is often complicated by bleaching, blinking and related photodamage and toxicity.
Second harmonic nanodoublers serve as an alternative to FCS. These are nanocrystallites that do are transparent at both the fundamental and second harmonic frequencies. Light is emitted through a non-resonant interaction that relies on the non-centrosymmetric crystal structure of the material. Owing to this lossless, virtual transition process, nanodoublers do not bleach over time and emit a stable, non-saturating signal with an instantaneous response time. This allows for the observation of fast dynamic processes over a long time. In addition, the SHG intensity can in principle be related to the orientation of the nanodoublers.
With our widefield imaging approach we can follow the rotation and translation of nanodoublers in-vitro with 50 microseconds acquisition time per image. The rotational diffusion can be derived from variations in the second harmonic intensity that originates from the rotations of the crystal principal axis.
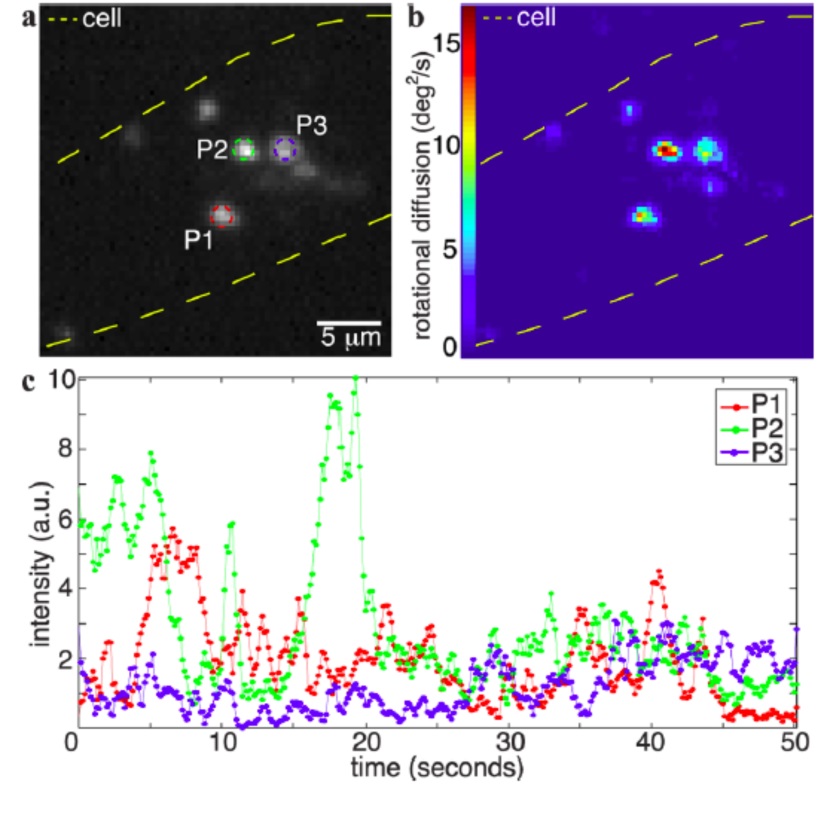
Spatial mapping of the rotational diffusion of 100 nm KNbO3 nanodoublers inside a living HeLa cell. (a) Second harmonic intensity of the intensity integrated over all the frames of a movie taken with an acquisition time per frame of 50 μs. (b) Spatial map of the rotational diffusion obtained from the relation between the variations in intensity and the rotation of the nanodoublers. (c). Temporal evolution of the second harmonic intensity at the points in (a) denoted as P1, P2 ,and P3. See for more details: Nano Lett, (2014), 14, 2552–2557
Collaborators: Aleksandra Radenovic
Low fluence Label-free Neuroimaging
The wide field imaging system can be used to perform label-free imaging of living mammalian neurons, using (1) a white light illumination (with a white light source placed at the yellow spot if the above figure), (2) the endogenous two photon response of the neurons, and (3) the endogenous second harmonic response of the non-centrosymmetric arrangement of fibers in the neurons.
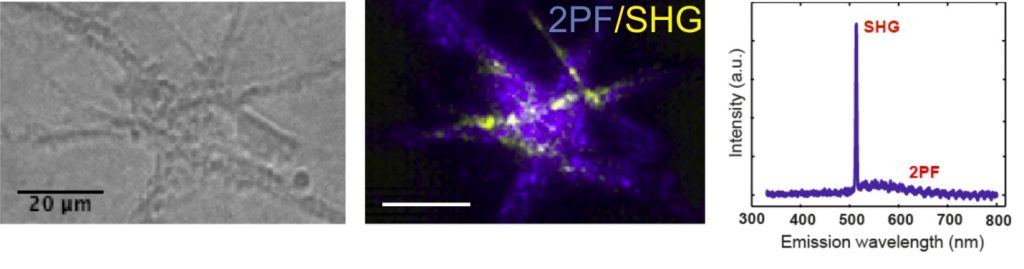
Label-free SHG imaging of living neurons. From left to right: (i) A bright field image of a part of the neuronal culture that was subsequently imaged with TPF and SHG. (ii) Composite image of the endogenous two-photon fluorescence intensity (blue) and the SHG intensity (yellow). The images were obtained with a 6 s acquisition time and a fluence of 7.3 mJ/cm2 (or averaged intensity <I> = 147 W/cm2). (iii) The spectrum of the central part of the bright field image. See for more information: Opt. Express (2014) 22 (25), 31102-31112.
Collaborators: Pierre Magistretti, Pascal Jourdain, Pierre Marquet