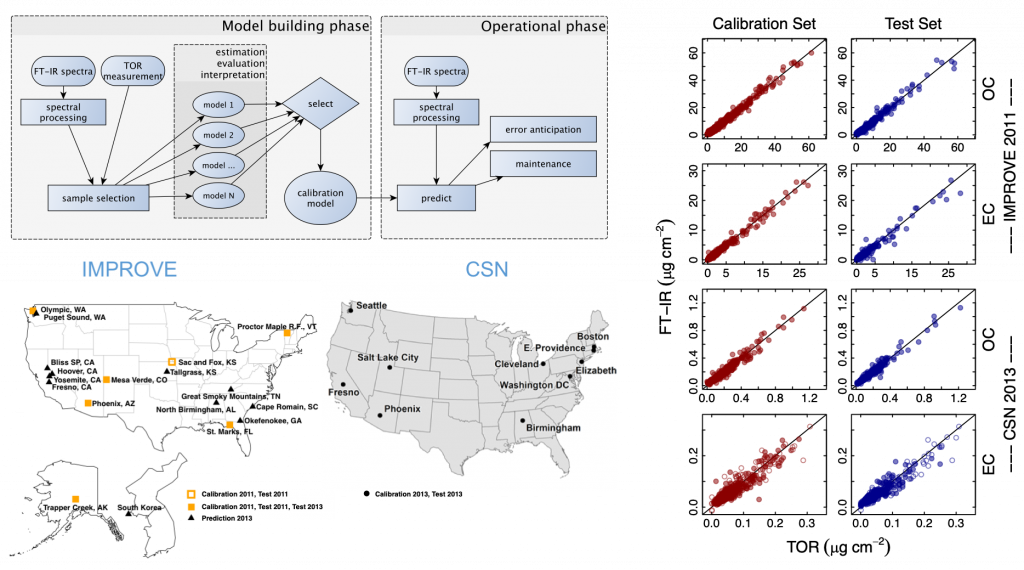
Particulate matter composition in monitoring networks
We are developing methods for cost-effective, routine measurement of PM2.5 chemical composition together with researchers at the Air Quality Research Center at the University of California Davis. Teflon filters are commonly used for collection and measurement of PM2.5 gravimetric mass for regulatory monitoring, intensive field campaigns, and epidemiological studies; its mid-infrared spectrum can be obtained rapidly and non-destructively simply by placing the filter in the path of the beam of a standard Fourier transform infrared (FT-IR) spectrometer. This spectrum is rich in chemical information, containing absorption bands for major constituents comprising the PM2.5 mass. However, overlapping bands and unknown absorption intensities of analytes can pose challenges for quantification. By judicious selection and evaluation of laboratory standards, collocated measurements, and statistical algorithms, we have demonstrated calibrations to access chemical information that is expensive or difficult to obtain otherwise (e.g., oranic and elemental carbon abundance); and furthermore provide unique information regarding the complex organic fraction of the PM2.5 using via analysis of its functional group composition.
Trend analyses of pollutant concentrations
A retrospective analysis of pollutant concentrations are critical for evaluating the effectiveness of regulatory policies and investments by industry made to improve air quality; and to understand how air quality is evolving toward the immediate future. Ozone is one regulated pollutant for which precursor reductions were expected to play a mitigating role in the exceedances of recommended limit values. In collaboration with the Swiss Federal Institute for Materials Science and Technology (Empa), new statistical methods were applied to analyze decades of ozone concentrations across Switzerland and Europe. Response to reductions in anthropogenic emissions varied by site type (e.g., urban vs. rural), but atmospheric concentrations and patterns were found to become more similar among the sites over time. Similar trends were found for Europe, but with the additional insight that changes in seasonal oscillations varied according to geographical region rather than site type and overall pollution levels. These analysis not only enable understanding of the real atmospheric response to anthropogenic perturbations, but provide detailed patterns that air quality models should reproduce to give us confidence in their underying mechanisms and capability to predict future air quality.
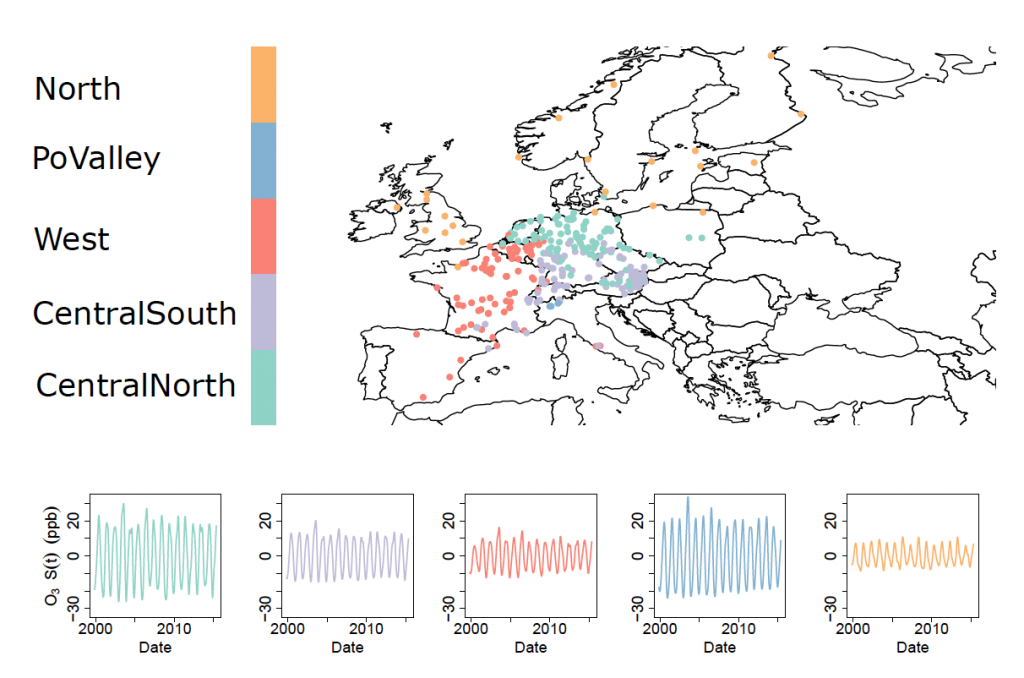
Figure 2: European monitoring sites clustered by seasonal patterns extracted from long-term time series of ozone concentrations. From Boleti et al., Atmos. Chem. Phys. Discuss., doi:10.5194/acp-2019-909, 2019.
Selected references.
- Takahama, S., Dillner, A. M., Weakley, A. T., Reggente, M., Bürki, C., Lbadaoui-Darvas, M., Debus, B., Kuzmiakova, A., and Wexler, A. S.: Atmospheric particulate matter characterization by Fourier transform infrared spectroscopy: a review of statistical calibration strategies for carbonaceous aerosol quantification in US measurement networks, Atmos. Meas. Tech. 12, 525–567, 2019.
- Bürki, C., Reggente, M., Dillner, A. M., Hand, J. L., Shaw, S. L., and Takahama, S.: Analysis of functional groups in atmospheric aerosols by infrared spectroscopy: method development for probabilistic modeling of organic carbon and organic matter concentrations, Atmos. Meas. Tech. Discuss. accepted, 2019.
- Boleti, E., Hueglin, C., Grange, S. K., Prévôt, A. S. H., and Takahama, S.: Temporal and spatial analysis of ozone concentrations in Europe based on time scale decomposition and a multi-clustering approach, Atmos. Chem. Phys. Discuss. in review, 2019.