The assessment of uncertainties of snow measurements remains a challenging problem in snow sciences. Snow cover properties are highly heterogeneous in both space and time, and the representativeness of measurements of snow variables (e.g., snow depth, snow density, and snow water equivalent (SWE)) is often overlooked or ignored because of difficulties associated with the assessment of such uncertainties. This has been, at least in part, due to limited knowledge of the characteristics of the spatial statistical properties of variables such as snow depth and SWE, particularly at the small scales (sub-meter to tens of meters). However, a turning point has been reached in recent years thanks to improvements in remote sensing of snow. Data sets with very high spatial resolution and accuracy are now available from LiDAR (Light Detection and Ranging) and Radar surveys. We are taking advantage of these improvements to introduce a quantitative framework to evaluate the uncertainty in the spatial mean when obtained from a limited number of measurements, with specific examples for the case of snow depth. We quantify the error as the expected value of the squared difference between the real mean of the field and the sample mean from a limited number of measurements. Using high-resolution (~ 1m) LIDAR snow depths, we show that the sample errors follow the theoretical behavior, and illustrate how this theoretical framework can be used for optimal survey design. These type of approaches can be used to improve the estimation of spatial means as used by physical and statistical snow models (e.g., grid-based and multi-variable regression models), and allow for an objective assessment of uncertainties when spatial survey data is used to validate model results. Both aspects are highly important for snow sciences.
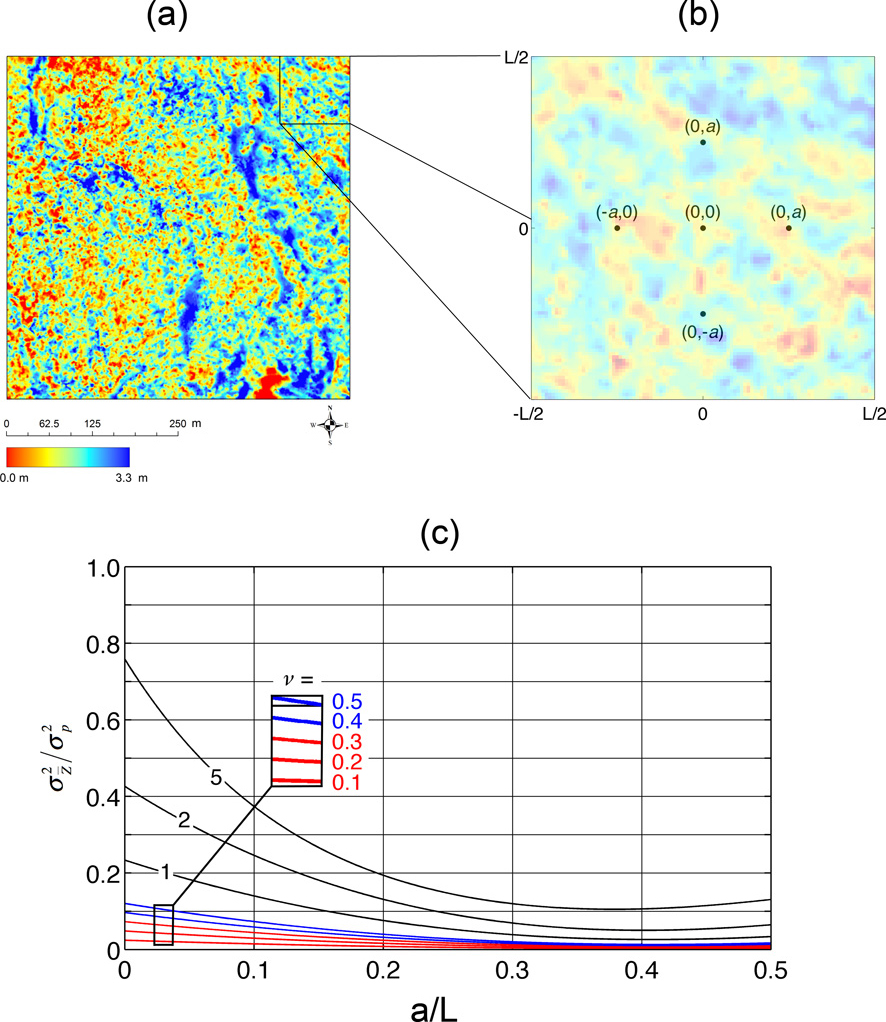
An example application is shown in the Figure below for a 5-point survey design. The expected error in the sample mean from the five points (Figure 1c) decreases as the separation distance between the point increases, with a minimum (or optimum location) at an intermediate distance. These results show that optimal survey designs can be objectively evaluated and corroborated with the high-resolution measurements from LiDAR. We are currently exploring such applications in different environments, at different times in the season, and for different survey designs.