| 13 October 2017 ___________________________________________ In a paper published in the journal Neuroinformatics, a team of scientists led by the Blue Brain Project, in collaboration with the Laboratory for Topology and Neuroscience, explain how the invention of the Topological Morphology Descriptor (TMD), provides a method for encoding the spatial structure of any tree as a “barcode”, a unique topological signature. Many biological systems consist of branching structures that exhibit a wide variety of shapes. Understanding of their systematic roles is hampered from the start by the lack of a fundamental means of standardizing the description of complex branching patterns, such as those of neuronal trees. As opposed to traditional morphometrics, the TMD couples the topology of the branches with their spatial extents by tracking their topological evolution in 3-dimensional space. The team prove that neuronal trees, as well as stochastically generated trees, can be accurately categorized based on their TMD profiles. The TMD retains sufficient global and local information to create an unbiased benchmark test for their categorization and is able to quantify and characterize the structural differences between distinct morphological groups. The use of this mathematically rigorous method will advance our understanding of the anatomy and diversity of branching morphologies. Click here to read the paper. |
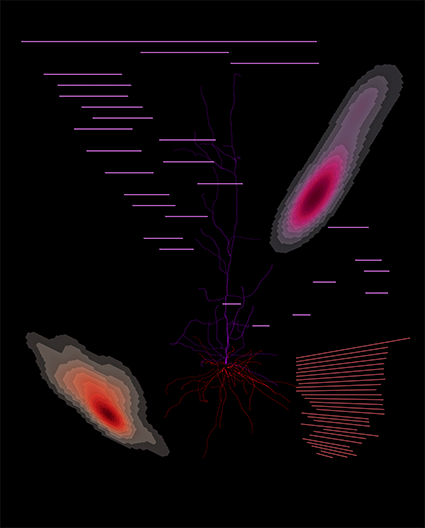
Topological Representation of Branching Neuronal Morphologies Illustration of a layer 5 pyramidal cell from the rat somatosensory cortex, and an artistic representation of the topology of its dendrites. A major challenge in neuroscience has been to reliably describe the different shapes of neurons. The Topological Morphology Descriptor (TMD) encodes the spatial structure of a tree into a persistence barcode, coupling the topology of the branching morphology with its geometry. The TMD retains sufficient global and local information to quantify and characterize the structural differences between distinct morphological groups. The dendrites (basals in red, apical in purple) of a Layer 5 cortical pyramidal cell are illustrated in this figure. The topological barcodes of the two types of dendrites (shown in the figure) encode the starting and ending radial distance of the tree’s branches from the soma and can be summarized in the density profiles also presented in the figure. Illustration: Lida Kanari |