Description
This pages describes the statistics on the positive flashes measured at the Säntis tower.
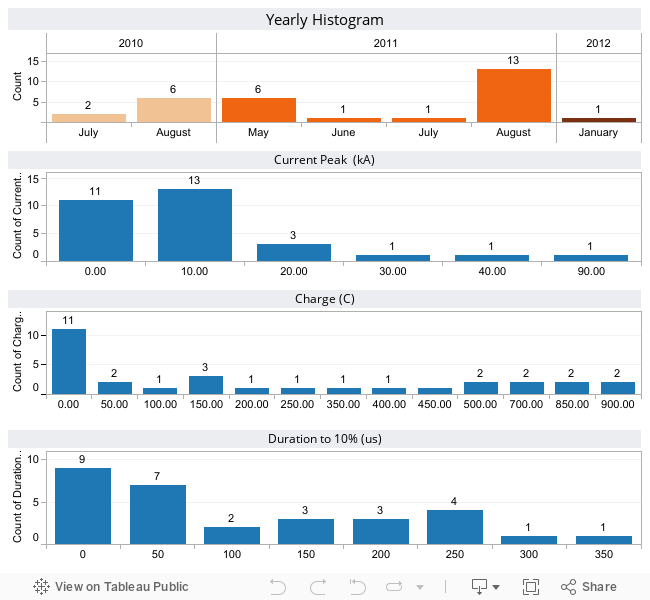
Monthly Statistics
In the following table we show the positive Flashes measured parameters (current, charge and flash duration)
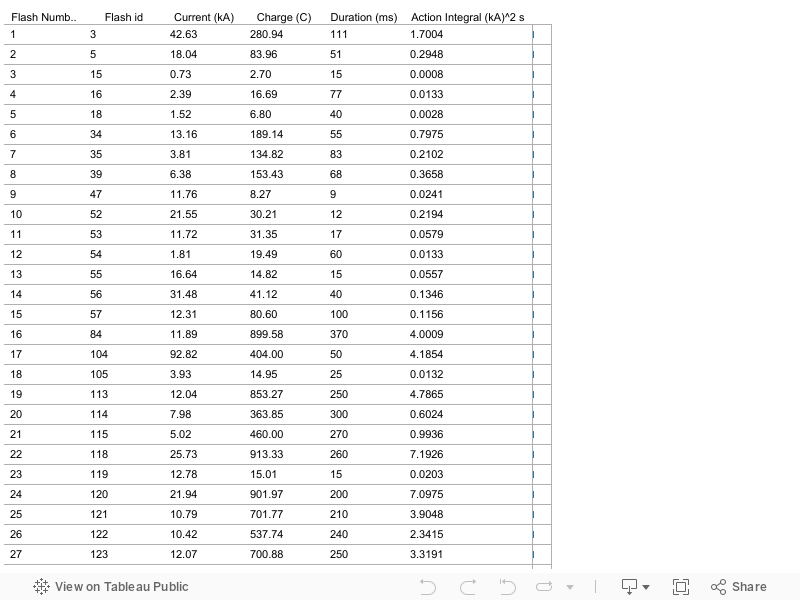
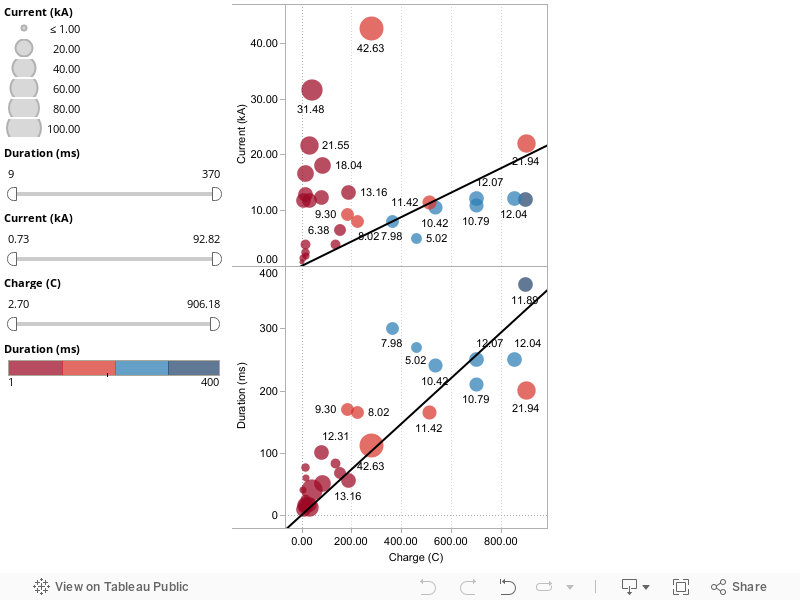
Some relations between variables can be seen in the following figure. The flash duration is encoded in colors and the current is encoded in the bubble size (some bubbles depict the current (in kA) value for guidance).
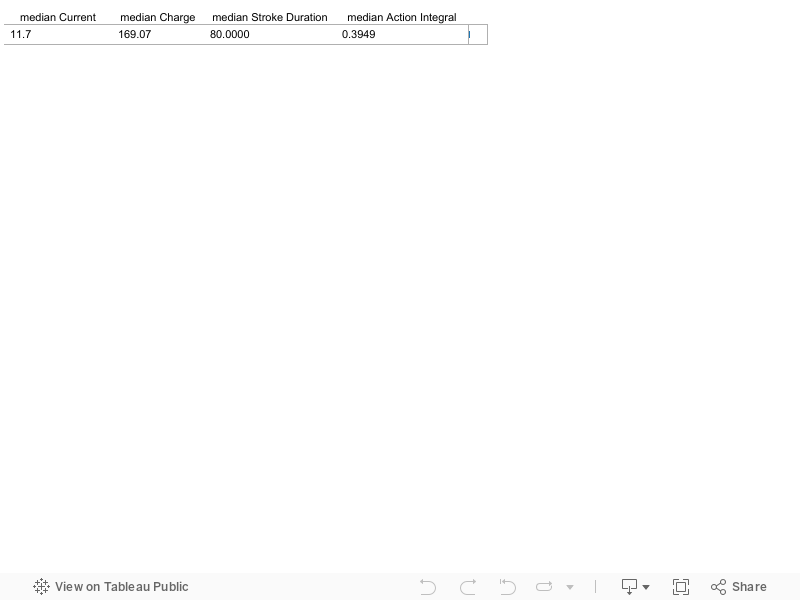
Median Values for Upward Positive Flashes
Median Values
The calculated median values for upward positive flashes are shown on the following table
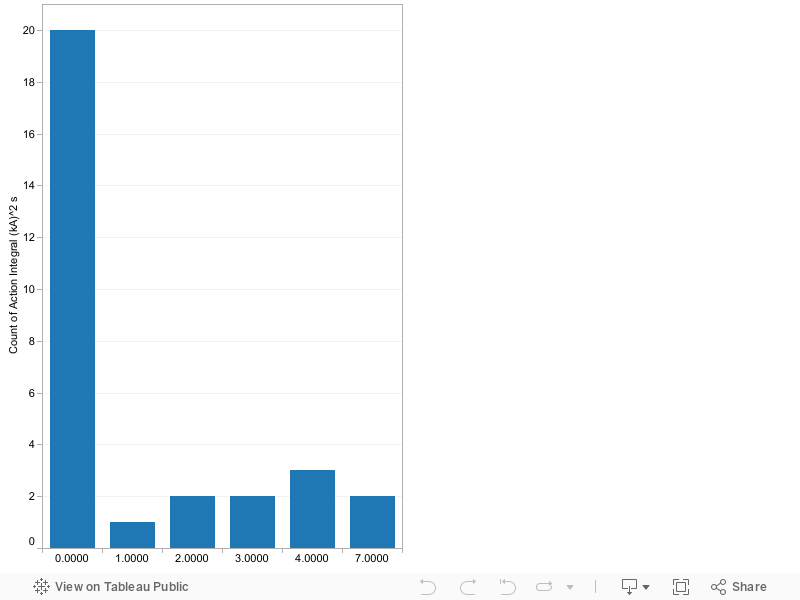
Action Integral
The integral of the squared current over the signal period serves as a measure of energy (using i2R and R=1 Ohm). The distribution dont follow the lognormal pattern (lognormality fails a KS test).